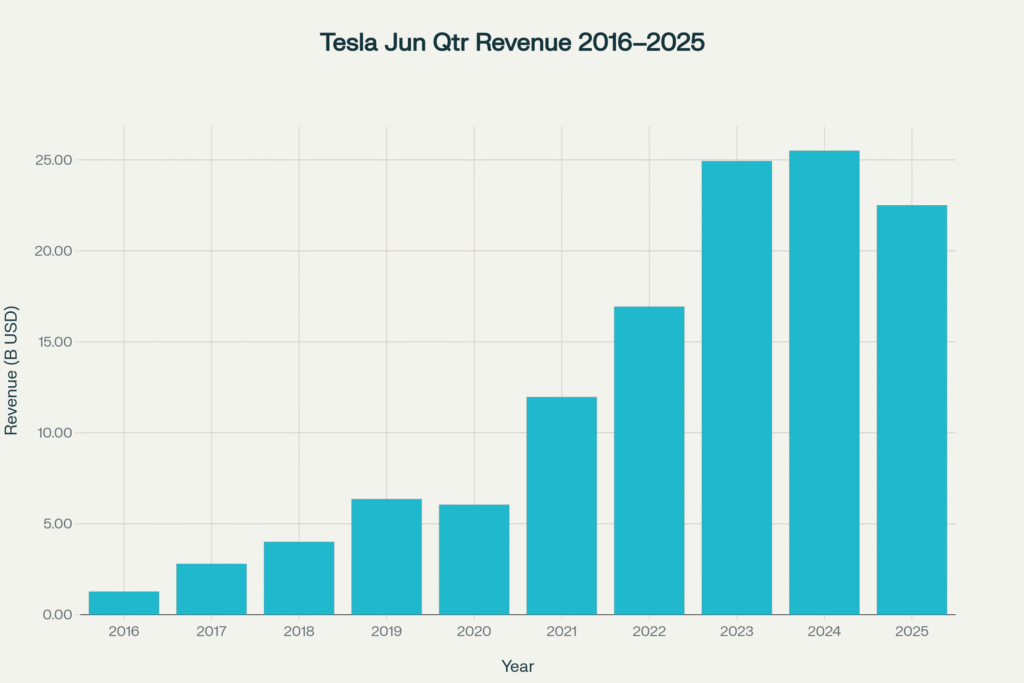
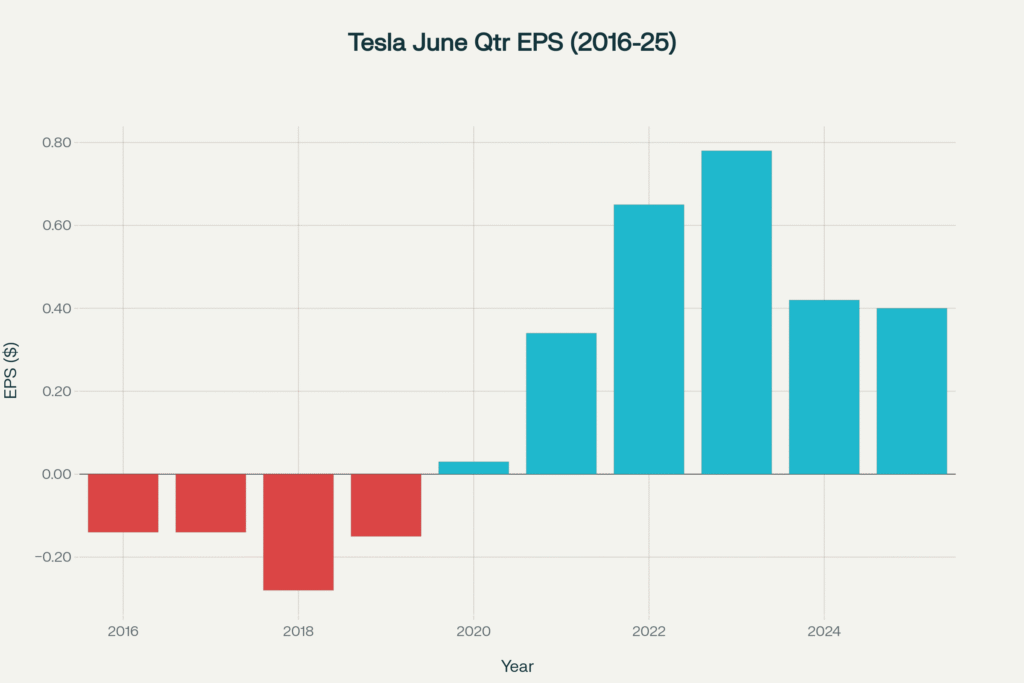
Tesla has transformed from a niche electric vehicle startup into one of the most valuable carmakers in the world. A key aspect of understanding Tesla’s growth is analyzing its financial performance over the years, particularly its revenue and earnings per share (EPS). In this post, we’ll look at Tesla’s revenue and profit figures for the June quarters of the last ten years, supported by visual bar charts (placeholders included), and interpret the significant trends.
Revenue Growth in Tesla’s June Quarters
Over the past decade, Tesla’s revenue in the June quarter has experienced explosive growth, reflecting both rising vehicle deliveries and expansion into energy and other sectors.
| Year | Revenue (Billion USD) |
|---|---|
| 2016 | 1.27 |
| 2017 | 2.79 |
| 2018 | 4.00 |
| 2019 | 6.35 |
| 2020 | 6.04 |
| 2021 | 11.96 |
| 2022 | 16.93 |
| 2023 | 24.93 |
| 2024 | 25.50 |
| 2025 | 22.50 |

Observations:
- Steady Growth: From just $1.27 billion in 2016, revenue grew over 17x by 2025, reaching $22.5 billion.
- Rapid Acceleration Post-2020: The years 2021-2023 marked exponential growth, driven by ramped-up Model 3 and Model Y production, and increased energy sales.
- 2024 Dip: Slight decline in 2025 could suggest market saturation or a temporary slowdown, but overall, Tesla’s revenue remains high.
Tesla’s Profitability: EPS Trends
Tesla Earnings: Profitability, measured via Earnings Per Share (EPS), has followed a similar growth trajectory, transitioning from losses to consistent profits.
| Year | EPS (USD) |
|---|---|
| 2016 | -0.14 |
| 2017 | -0.14 |
| 2018 | -0.28 |
| 2019 | -0.15 |
| 2020 | 0.03 |
| 2021 | 0.34 |
| 2022 | 0.65 |
| 2023 | 0.78 |
| 2024 | 0.42 |
| 2025 | 0.40 |

Key Takeaways:
- From Losses to Profits: Tesla’s EPS moved from negative in 2016-2018 to positive starting in 2020, indicating a significant shift in profitability.
- Peak Profitability: In 2023, EPS peaked at $0.78, reflecting robust earnings for investors.
- Recent Decline: Slight drop in EPS in 2024 and 2025 suggests market variability or cost pressures but remains above break-even.
Interpreting the Trends
Growth Trajectory:
Tesla’s revenue and EPS have shown a sharp upward trend, especially post-2020. The rapid growth underscores Tesla’s scaling ability, driven by increased vehicle production, expanding energy business, and market acceptance of EVs.
Volatility and Recent Trends:
While revenues stay high, recent EPS figures indicate some volatility. This could stem from supply chain challenges, raw material costs, R&D investments, or macroeconomic factors affecting earnings.
Future Outlook:
If Tesla continues its impressive growth trajectory—further expanding production capacity, launching new models like the Cybertruck, and increasing energy storage and solar solutions—it is reasonable to anticipate that both revenue and profitability will keep climbing over the coming years. The company’s aggressive investment in battery technology and autonomous driving software positions it well to capitalize on future mobility trends. Additionally, Tesla’s global expansion into new markets, including China and Europe, can accelerate sales growth. However, investors should also remain cautious of potential macroeconomic headwinds such as supply chain disruptions, rising raw material costs, regulatory challenges, and increased competition in the EV space. While Tesla’s past performance has been remarkable, sustained success will depend on execution, innovation, and market conditions.
Conclusion
Tesla’s financial journey over the last decade reflects remarkable expansion and transformative growth. Its revenue has grown exponentially, and profitability has shifted from losses to steady profits, reinforcing investor confidence. Though recent figures show some fluctuation, the long-term trend appears robust.
Remember, these figures are historical and do not guarantee future performance. Always perform your own due diligence before making investment decisions.
