Tag: trading

  • Intel earnings – headcount to drop to 75,000 – but have layoffs helped in the past?

    Intel earnings – headcount to drop to 75,000 – but have layoffs helped in the past?

    Intel, once the uncontested titan of semiconductors, has undergone significant restructuring over the past decade in a bid to restore its competitive edge and profitability. Among the most dramatic of these moves has been a series of large-scale workforce reductions. In this blog, we examine whether these aggressive layoffs have delivered the intended positive impact on Intel earnings, digging into the numbers and underlying trends.

    1. Intel’s Layoff Timeline: An Overview

    Intel reduced its workforce in several waves:

    • 2023–2025: Most notable rounds, with approximately 15% of employees cut annually in 2024 and 2025(ongoing). Headcount expected to drop from nearly 125,000 to 75,000.
    • Early 2020s: Several smaller layoffs and efficiency pushes, generally less than 5% of employees at a time.

    These layoffs were part of broader cost-cutting drives, amid declining market share and intense competition from AMD and Nvidia.

    2. The Rationale: Why Cut Jobs?

    Intel’s leadership repeatedly cited the need to reduce expenses, streamline management, and fund future technology bets as reasons for job cuts. The goal was simple: improve margins and return to profitable, revenue-generating growth after years of stagnation and strategic missteps which will eventually improve Intel earnings.

    3. The Earnings Record: What Do The Numbers Say?

    intel earnings

    Let’s examine key data from Intel’s most recent and substantial layoff periods, focusing on the financial impact.

    Table: Intel Annual Employee Count (2020–2025)

    YearWorkforce (End-Q2)Revenue (B USD)Net Income/Loss (B USD)EPS (USD)Major Layoffs?
    2020~110,60019.75.11.19No
    2021~121,10019.65.11.19No
    2022~131,90015.31.00.25No
    2023~124,80012.9-1.6-0.41Minor
    2024~108,90012.8-1.6-0.43Yes (15%)
    2025(proj)~75,00012.8-2.9-0.77Yes (15%)

    Note: 2025 numbers reflect projections and reported ongoing mass layoffs but will be finalized at year-end.

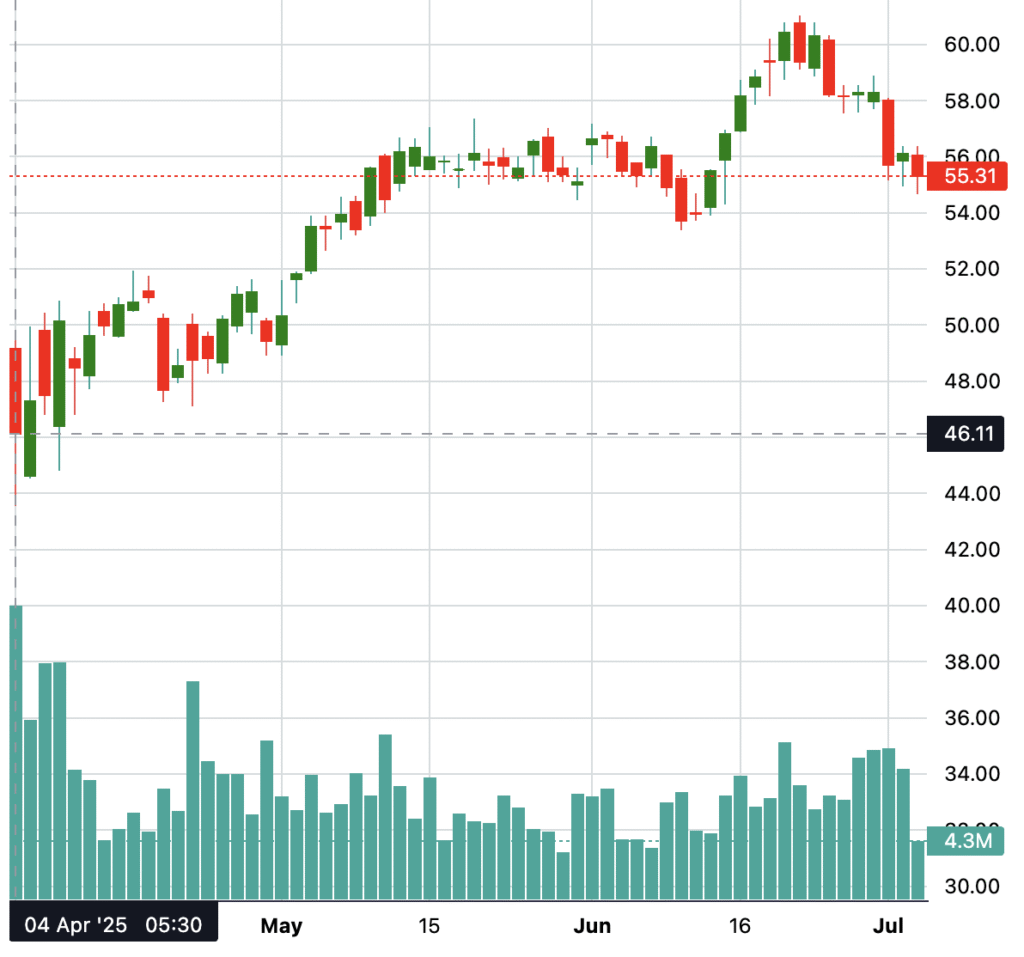
    Immediate Impact on Intel earnings

    • 2024–2025 Losses: Despite headline-grabbing layoffs, Intel’s net losses expanded: from -$1.6B in Q2 2024 to -$2.9B in Q2 2025. EPS also worsened.
    • 2025 Charges: Layoffs and restructuring accounted for $1.9B in charges in Q2 2025 alone—swamping any labor cost savings realized during the period.
    • Revenue Plateau: Revenue remained flat at $12.8–$12.9B, suggesting that layoffs failed to jumpstart growth .

    Market Reaction

    Intel’s stock rose modestly (about 3%) on initial layoff announcements, reflecting optimism about eventual cost savings, but shares quickly reversed course as earnings reports showed continued losses and one-time charges absorbed any savings.

    4. Precedents: Earlier Layoffs and Financial Performance

    Intel periodically trimmed its workforce over the last decade—but smaller reductions in the early 2020s also failed to manifest as clear profit growth or competitive resurgence.

    • 2016–2019: Workforce reductions and a series of restructurings produced short-term cost savings but did not reverse slumping margins or market share loss.
    • 2020–2022: Despite holding steady or modestly reducing staff, Intel saw sharp drops in profit as R&D underinvestment and tough competition sapped growth.

    5. Why Didn’t Layoffs Spur Profitability?

    Several factors explain the lack of immediate lift in Intel earnings:

    • Restructuring Costs: Each major layoff resulted in large one-time expenses—$1.9B in Q2 2025—directly dragging down quarterly earnings.
    • Top-Line Pressure: Intel’s fundamental problem has been stagnant or falling sales. Even as employee costs dropped, flat revenues meant savings failed to translate into net profit .
    • Competitive Weakness: The loss of market share to AMD, Nvidia, and new AI chipmakers limited the upside from cost controls. Real profitability gains require robust top-line growth or margin expansion—neither of which layoffs alone could produce.
    • Talent Drain and Disruption: Large layoffs can harm culture, morale, and productivity, compounding execution risks during an attempted turnaround.

    6. The Longer View: Can Layoffs Ever Help?

    Intel’s management insists that cost-cutting—including layoffs—lays the groundwork for a leaner, stronger company. Indeed, workforce reductions can boost margins and profitability if matched with revenue stabilization and improved competitive positioning. However, as the past several years show, layoffs alone—especially amid sagging sales and heavy restructuring costs—do not deliver immediate, data-backed growth in Intel earnings.

    7. Conclusion: Layoffs Offer No Quick Fix

    The evidence is clear: layoffs over the past five years have not produced positive, immediate impacts on Intel earnings. Substantial one-time charges erased near-term savings, while ongoing revenue pressures meant that earnings continued to deteriorate despite a much smaller workforce. Only with sustainable top-line improvement and a proven roadmap rebound can cost reductions translate into real profit gains.

    For now, the layoff story at Intel serves as a cautionary tale: cost cuts alone are not a panacea, and effective turnaround demands a holistic focus on both expenses and growth engines.

    References:
    Q2 2024–2025 Intel earnings press releases and SEC filings.
    Financial data and layoff coverage from Reuters, Bloomberg, and major financial news outlets.

    Disclaimer:
    The data and information presented in this blog are sourced from third-party providers and are for educational and informational purposes only. We do not guarantee the accuracy, completeness, or authenticity of this data. Past performance is not indicative of future results. Always perform your own due diligence and consult with a licensed financial advisor before making any investment decisions. Use this information at your own risk.

  • Comparing Kohl’s and GameStop: The Short Squeeze Phenomenon

    Comparing Kohl’s and GameStop: The Short Squeeze Phenomenon

    In the investment world, few events have captured widespread attention quite like a short squeeze, especially the explosion of GameStop (GME) in early 2021. Retail investors, fueled by social media coordination, drove up the stock price dramatically, forcing short sellers to cover their positions at huge losses. But did other companies, like Kohl’s (KSS), experience similar short squeeze conditions early on? Let’s explore and compare the two case studies.


    The GameStop Short Squeeze: A Brief Overview

    GameStop (GME), a well-known brick-and-mortar video game retailer, became the poster child of a short squeeze. Hedge funds and institutional investors had heavily shorted GME — betting its stock price would decline — with short interest soaring well over 100% of shares available.

    By January 2021, the short interest ratio (also called the “days to cover”) was over 12 days, indicating a massive risk for short sellers. Simultaneously, retail traders on Reddit’s WallStreetBets coordinated to buy and hold GameStop shares, fueling a rapid rise in the stock price from around $20 to an astonishing over $400 within weeks. As the price soared, short sellers faced massive margin calls, forcing them to buy back shares at the higher price, which further drove the stock price up — a typical short squeeze spiral.

    Key factors during GME’s surge:

    • Extreme short interest (> 100% of float)
    • High days-to-cover ratio (possible to cover short position in days)
    • Social media coordination and viral momentum
    • Short sellers scrambling to cover at the peak

    This event was driven by a mixture of market mechanics and social psychology, creating an explosive market phenomenon that made headlines worldwide.


    Kohl’s: Did It Experience a Similar Short Squeeze?

    Kohl’s (KSS), a retail chain with a long history, was also heavily shorted— but it did not experience a GME-style short squeeze at the start.

    While Kohl’s stock had a high short-interest ratio, it lacked several crucial ingredients that fueled the GameStop frenzy:

    Key differences:

    • Short interest levels: While high, they did not exceed 100% of available shares. Short interest hovered around 20-30%, which is significant but not as extreme.
    • Market narrative: Kohl’s lacked the meme stock appeal or viral social media movement. It didn’t attract the same retail-driven hype.
    • Price activity: After any decline, Kohl’s monthly or quarterly moves remained within narrow ranges, with no rapid, exponential surges.
    • Retail campaign: No organized, viral retail movement coordinated to buy or hold Kohl’s shares en masse.

    What happened afterward?

    In some instances, Kohl’s saw modest price rebounds or continued sideways trading, but no dramatic short squeeze occurred. Investors perhaps viewed Kohl’s as fundamentally challenged but less speculative than GME.

    Some traders might have hoped for a squeeze, but the absence of social momentum, combined with less-than-astronomical short interest, kept Kohl’s from replicating GME’s fireworks.


    Why the Difference?

    Analyzing these two cases reveals the critical ingredients behind a short squeeze:

    AspectGameStopKohl’s
    Short interestOver 100% of float20-30% of float
    Market narrativeMeme stock, social hypeNo meme hype, fundamentals challenged
    Social momentumViral social media driving buyingNo organized retail rally
    Price responseExplosive, exponential growthSmall fluctuation, sideways trend
    Short sellers’ fateForced to buy back at high pricesNo such pressure

    The market mechanics such as high short interest and days to cover are necessary but not sufficient for a squeeze unless amplified by social sentiment. GME’s explosive rise was as much social phenomenon as it was a technical trading event.


    What Can Investors Learn?

    • large short interest is a warning sign but does not guarantee a squeeze.
    • Social media hype or viral campaigns significantly increase the likelihood.
    • Companies with high fundamental challenges and no retail rally backing tend to remain volatile or decline without a squeeze.

    In conclusion, while both stocks experienced significant drops in the past, only GameStop experienced a full-blown short squeeze driven by social momentum and technical risks. Kohl’s displayed typical volatility but didn’t reach the same explosive levels.


    Disclaimer:
    This blog is for educational purposes. Always do your own research before investing.

  • What happened in the past after EQT Corporation stock fell more than 9% in a day

    On Monday, July 21, 2025, EQT Corporation’s share price experienced a sharp decline of over 9%. Such significant intraday drops often make investors wonder: what typically happens in the subsequent months? Do stocks usually rebound, plateau, or continue to decline? To gain insight, let’s analyze historical instances where EQT stock witnessed similar substantial drops and observe how it performed over the next three months.

    Historical Instances of Large Price Drops & Their 3-Month Outcomes

    4th April 2025 (-11.48%)

    On April 4th, 2025, EQT stock plummeted by 11.48%. Curiously, over the following three months, the stock demonstrated a strong recovery, climbing significantly from its low. This scenario suggests that sharp declines can sometimes be followed by a rebound, possibly driven by market correction, investor relief, or sector-specific catalysts.

    27th Jan 2025 (-9.72%)

    Just prior, on January 27th, 2025, EQT faced a nearly 10% loss. However, unlike the previous case, the stock displayed a volatile but sideways movement, ending the three-month period close to its starting point. This indicates that not all large drops lead to positive rebounds; instead, many stocks turn into choppy trading ranges, reflecting uncertainty or lack of clear catalysts.

    14th June 2022 (-9.41%)

    After dropping approximately 9.4%, EQT’s price in June 2022 experienced a moderate rally over the following months, although it also suffered sharp declines at times. This mixed performance underscores that large drops don’t guarantee directionality—volatility may persist before a clearer trend emerges.

    9th May 2022 (-10.96%)

    In May 2022, EQT’s stock declined nearly 11%, yet within three months, it showcased high volatility without a clear trend, swinging sharply up and down. Such behavior suggests that large intraday declines may sometimes lead to indecisiveness in the market, especially absent fundamental or sector-specific catalysts.

    29th July 2021 (-9.93%)

    In mid-2021, EQT experienced a roughly 10% drop, but over the subsequent three months, the stock ultimately moved higher, bucking the trend of continued decline. This rebound could have been driven by sector recovery, improved fundamentals, or broader market tailwinds.

    What Can We Learn From These Examples?

    Examining these past instances reveals that there is no consistent pattern following a large intraday drop. The stock can:

    • Experience a strong rebound (as seen in April 2025 and July 2021).
    • Enter a prolonged sideways or choppy phase (January 2025, May 2022).
    • Show high volatility with no clear trend (June 2022, May 2022).

    In other words, EQT’s subsequent three-month performance after a significant drop varies widely. External factors—sector conditions, macroeconomic trends, company-specific news—often influence these outcomes.

    Investment Takeaways

    • A large stock decline does not guarantee continued fallout; it can be a buying opportunity or just a temporary market reaction.
    • Investors should consider broader market conditions, earnings reports, and sector trends before making decisions based solely on short-term dips.
    • Diversification and proper risk management remain essential.

    Disclaimer

    The analysis above is purely educational and is based on historical data. Stock markets are unpredictable, and past performance does not guarantee future results. Always perform your own due diligence or consult a licensed financial advisor before investing.

    Data Source: All charts and data are sourced from Twelve Data, a third-party provider. While efforts are made to ensure accuracy, we do not guarantee the data’s authenticity or completeness.

    Final Thoughts

    While big drops can be intimidating, historical data shows they often don’t result in uniform outcomes. Whether EQT stock bounces back or remains volatile depends on many factors beyond just the percentage decline. As always, stay informed, diversify your portfolio, and invest wisely.