Tag: stock market

  • Tesla Earnings – 10 Years Trends – June Quarter

    Tesla Earnings – 10 Years Trends – June Quarter

    Tesla has transformed from a niche electric vehicle startup into one of the most valuable carmakers in the world. A key aspect of understanding Tesla’s growth is analyzing its financial performance over the years, particularly its revenue and earnings per share (EPS). In this post, we’ll look at Tesla’s revenue and profit figures for the June quarters of the last ten years, supported by visual bar charts (placeholders included), and interpret the significant trends.


    Revenue Growth in Tesla’s June Quarters

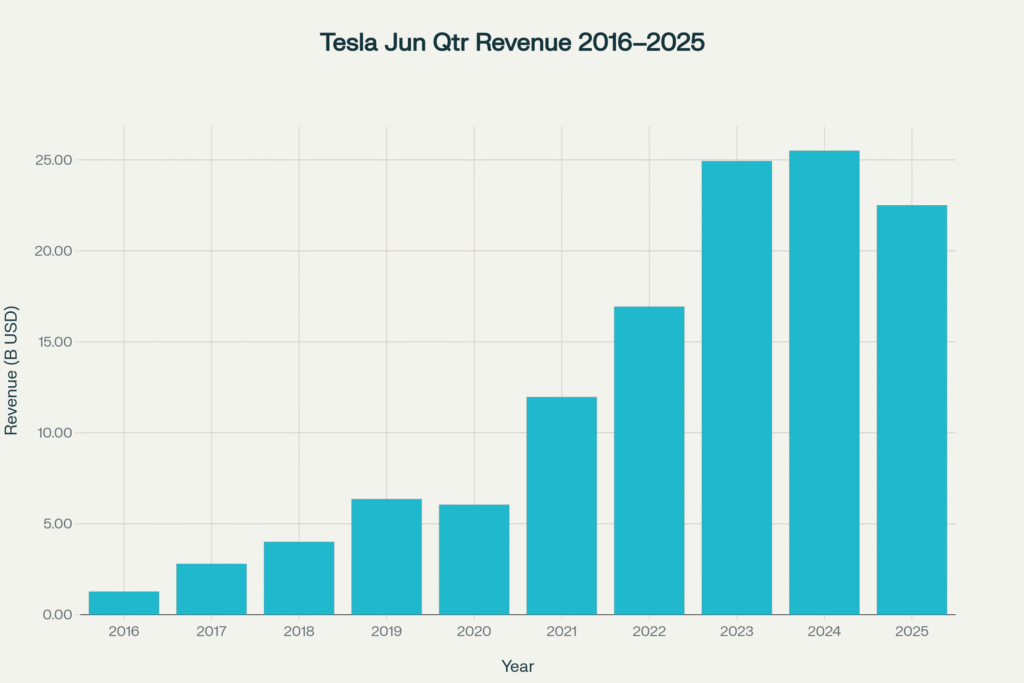
    Over the past decade, Tesla’s revenue in the June quarter has experienced explosive growth, reflecting both rising vehicle deliveries and expansion into energy and other sectors.

    YearRevenue (Billion USD)
    20161.27
    20172.79
    20184.00
    20196.35
    20206.04
    202111.96
    202216.93
    202324.93
    202425.50
    202522.50

    Observations:

    • Steady Growth: From just $1.27 billion in 2016, revenue grew over 17x by 2025, reaching $22.5 billion.
    • Rapid Acceleration Post-2020: The years 2021-2023 marked exponential growth, driven by ramped-up Model 3 and Model Y production, and increased energy sales.
    • 2024 Dip: Slight decline in 2025 could suggest market saturation or a temporary slowdown, but overall, Tesla’s revenue remains high.

    Tesla’s Profitability: EPS Trends

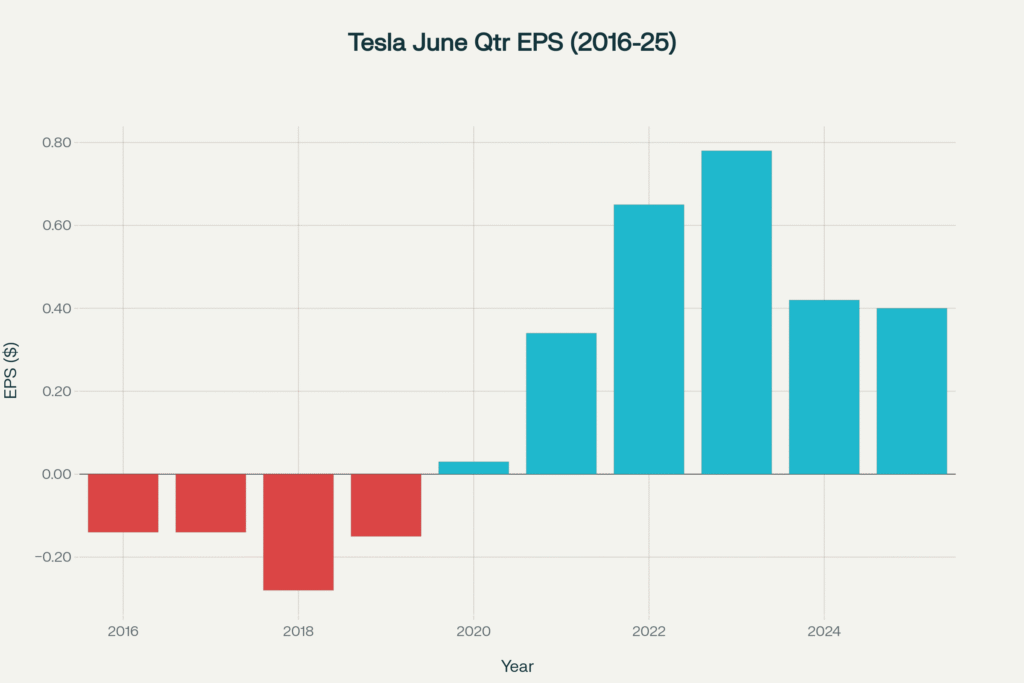
    Tesla Earnings: Profitability, measured via Earnings Per Share (EPS), has followed a similar growth trajectory, transitioning from losses to consistent profits.

    YearEPS (USD)
    2016-0.14
    2017-0.14
    2018-0.28
    2019-0.15
    20200.03
    20210.34
    20220.65
    20230.78
    20240.42
    20250.40

    Key Takeaways:

    • From Losses to Profits: Tesla’s EPS moved from negative in 2016-2018 to positive starting in 2020, indicating a significant shift in profitability.
    • Peak Profitability: In 2023, EPS peaked at $0.78, reflecting robust earnings for investors.
    • Recent Decline: Slight drop in EPS in 2024 and 2025 suggests market variability or cost pressures but remains above break-even.

    Interpreting the Trends

    Growth Trajectory:

    Tesla’s revenue and EPS have shown a sharp upward trend, especially post-2020. The rapid growth underscores Tesla’s scaling ability, driven by increased vehicle production, expanding energy business, and market acceptance of EVs.

    Volatility and Recent Trends:

    While revenues stay high, recent EPS figures indicate some volatility. This could stem from supply chain challenges, raw material costs, R&D investments, or macroeconomic factors affecting earnings.

    Future Outlook:

    If Tesla continues its impressive growth trajectory—further expanding production capacity, launching new models like the Cybertruck, and increasing energy storage and solar solutions—it is reasonable to anticipate that both revenue and profitability will keep climbing over the coming years. The company’s aggressive investment in battery technology and autonomous driving software positions it well to capitalize on future mobility trends. Additionally, Tesla’s global expansion into new markets, including China and Europe, can accelerate sales growth. However, investors should also remain cautious of potential macroeconomic headwinds such as supply chain disruptions, rising raw material costs, regulatory challenges, and increased competition in the EV space. While Tesla’s past performance has been remarkable, sustained success will depend on execution, innovation, and market conditions.

    Conclusion

    Tesla’s financial journey over the last decade reflects remarkable expansion and transformative growth. Its revenue has grown exponentially, and profitability has shifted from losses to steady profits, reinforcing investor confidence. Though recent figures show some fluctuation, the long-term trend appears robust.

    Remember, these figures are historical and do not guarantee future performance. Always perform your own due diligence before making investment decisions.


    Disclaimer:
    The data and information presented in this blog are sourced from third-party providers and are for educational and informational purposes only. We do not guarantee the accuracy, completeness, or authenticity of this data. Past performance is not indicative of future results. Always perform your own due diligence and consult with a licensed financial advisor before making any investment decisions. Use this information at your own risk.

  • What happened in the past after EQT Corporation stock fell more than 9% in a day

    On Monday, July 21, 2025, EQT Corporation’s share price experienced a sharp decline of over 9%. Such significant intraday drops often make investors wonder: what typically happens in the subsequent months? Do stocks usually rebound, plateau, or continue to decline? To gain insight, let’s analyze historical instances where EQT stock witnessed similar substantial drops and observe how it performed over the next three months.

    Historical Instances of Large Price Drops & Their 3-Month Outcomes

    4th April 2025 (-11.48%)

    On April 4th, 2025, EQT stock plummeted by 11.48%. Curiously, over the following three months, the stock demonstrated a strong recovery, climbing significantly from its low. This scenario suggests that sharp declines can sometimes be followed by a rebound, possibly driven by market correction, investor relief, or sector-specific catalysts.

    27th Jan 2025 (-9.72%)

    Just prior, on January 27th, 2025, EQT faced a nearly 10% loss. However, unlike the previous case, the stock displayed a volatile but sideways movement, ending the three-month period close to its starting point. This indicates that not all large drops lead to positive rebounds; instead, many stocks turn into choppy trading ranges, reflecting uncertainty or lack of clear catalysts.

    14th June 2022 (-9.41%)

    After dropping approximately 9.4%, EQT’s price in June 2022 experienced a moderate rally over the following months, although it also suffered sharp declines at times. This mixed performance underscores that large drops don’t guarantee directionality—volatility may persist before a clearer trend emerges.

    9th May 2022 (-10.96%)

    In May 2022, EQT’s stock declined nearly 11%, yet within three months, it showcased high volatility without a clear trend, swinging sharply up and down. Such behavior suggests that large intraday declines may sometimes lead to indecisiveness in the market, especially absent fundamental or sector-specific catalysts.

    29th July 2021 (-9.93%)

    In mid-2021, EQT experienced a roughly 10% drop, but over the subsequent three months, the stock ultimately moved higher, bucking the trend of continued decline. This rebound could have been driven by sector recovery, improved fundamentals, or broader market tailwinds.

    What Can We Learn From These Examples?

    Examining these past instances reveals that there is no consistent pattern following a large intraday drop. The stock can:

    • Experience a strong rebound (as seen in April 2025 and July 2021).
    • Enter a prolonged sideways or choppy phase (January 2025, May 2022).
    • Show high volatility with no clear trend (June 2022, May 2022).

    In other words, EQT’s subsequent three-month performance after a significant drop varies widely. External factors—sector conditions, macroeconomic trends, company-specific news—often influence these outcomes.

    Investment Takeaways

    • A large stock decline does not guarantee continued fallout; it can be a buying opportunity or just a temporary market reaction.
    • Investors should consider broader market conditions, earnings reports, and sector trends before making decisions based solely on short-term dips.
    • Diversification and proper risk management remain essential.

    Disclaimer

    The analysis above is purely educational and is based on historical data. Stock markets are unpredictable, and past performance does not guarantee future results. Always perform your own due diligence or consult a licensed financial advisor before investing.

    Data Source: All charts and data are sourced from Twelve Data, a third-party provider. While efforts are made to ensure accuracy, we do not guarantee the data’s authenticity or completeness.

    Final Thoughts

    While big drops can be intimidating, historical data shows they often don’t result in uniform outcomes. Whether EQT stock bounces back or remains volatile depends on many factors beyond just the percentage decline. As always, stay informed, diversify your portfolio, and invest wisely.