Amazon (AMZN) stock has recently endured a sharp ~15-20% plunge in early February 2026, triggered by Q4 earnings that beat expectations but revealed aggressive $200B capex guidance for the year, raising investor concerns over near-term profitability amid heavy AI, cloud infrastructure, and robotics investments.
This analysis compares the event to two historical corrections via your attached 1-year charts, revealing Amazon’s resilient recovery patterns driven by its e-commerce dominance and AWS moat.
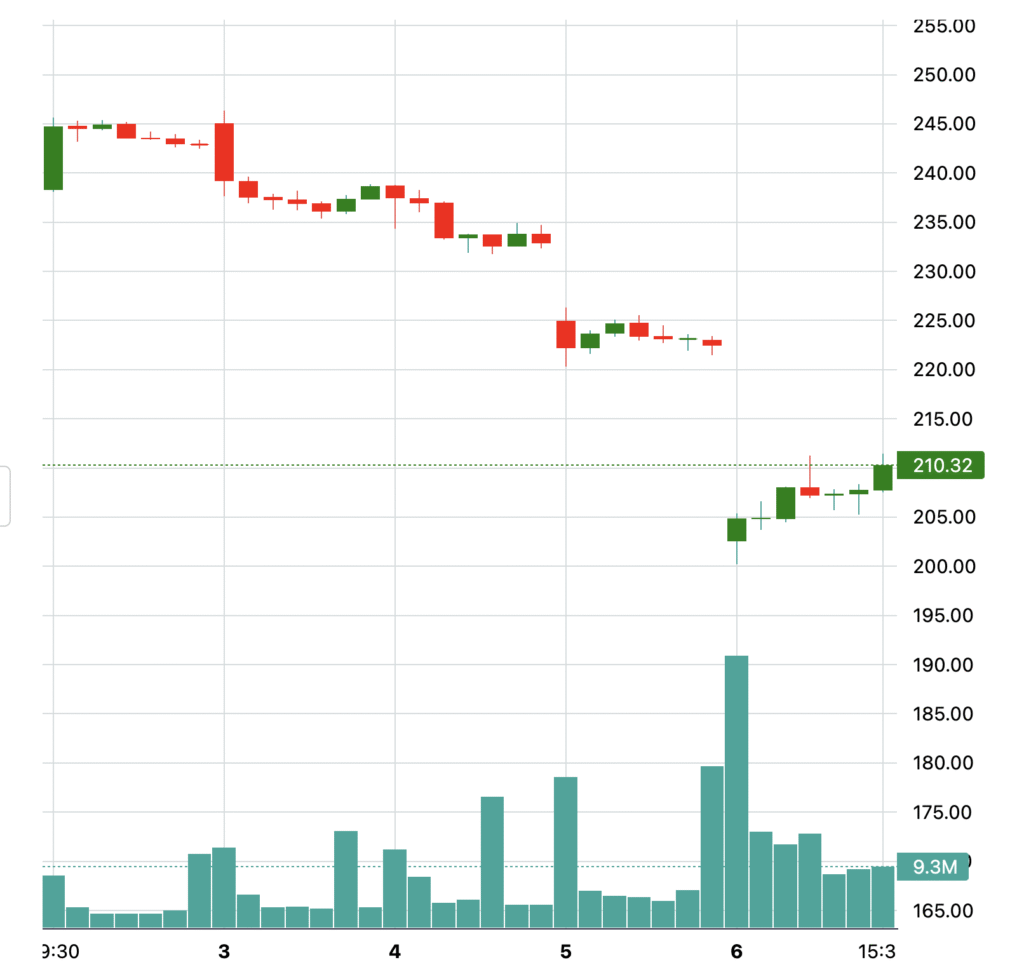
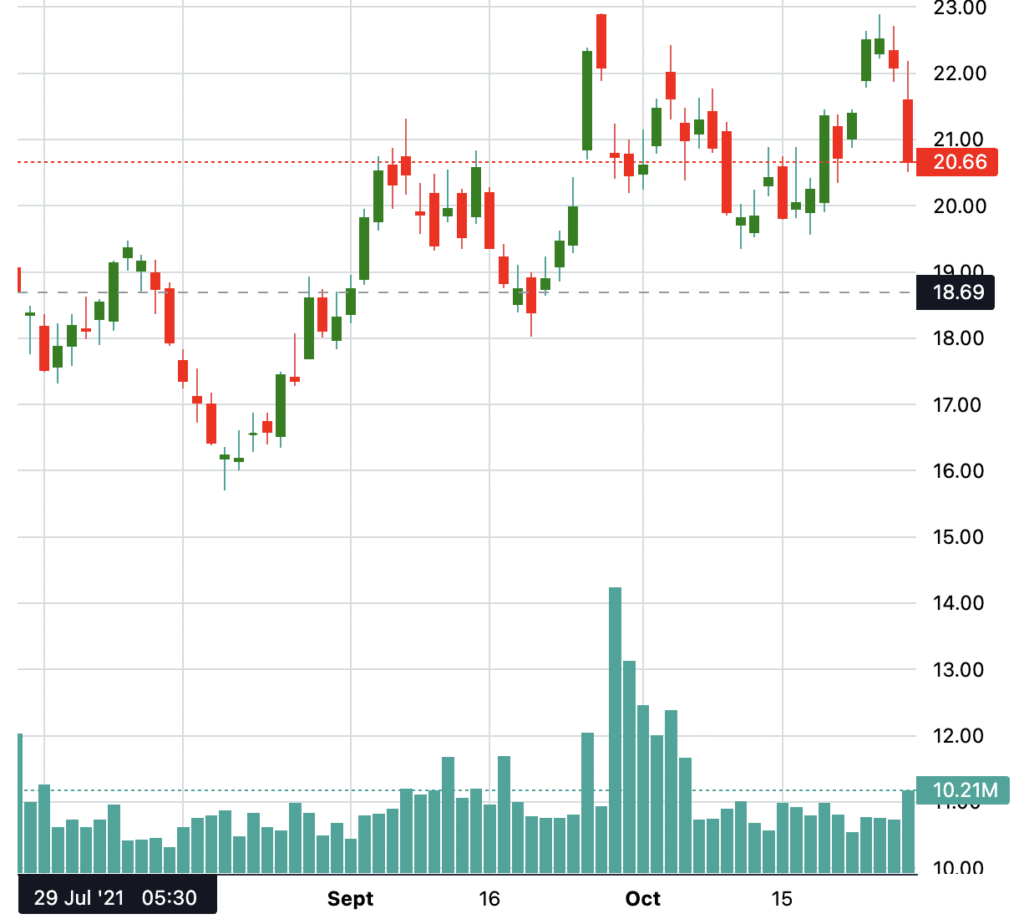
The above chart illustrates Amazon (AMZN) stock’s dramatic intraday plunge over a volatile 5-6 day period in early February 2026, peaking at $258.32 on the first day before cascading through a series of red candlesticks that erased roughly 18-20% of value, bottoming near $210.52 amid heavy selling pressure.
This recent AMZN plunge—dropping ~18-20% from $258 highs to $210 lows on surging volume—mirrors past corrections where short-term panic gave way to robust recoveries, as we’ll compare next with two historical instances.
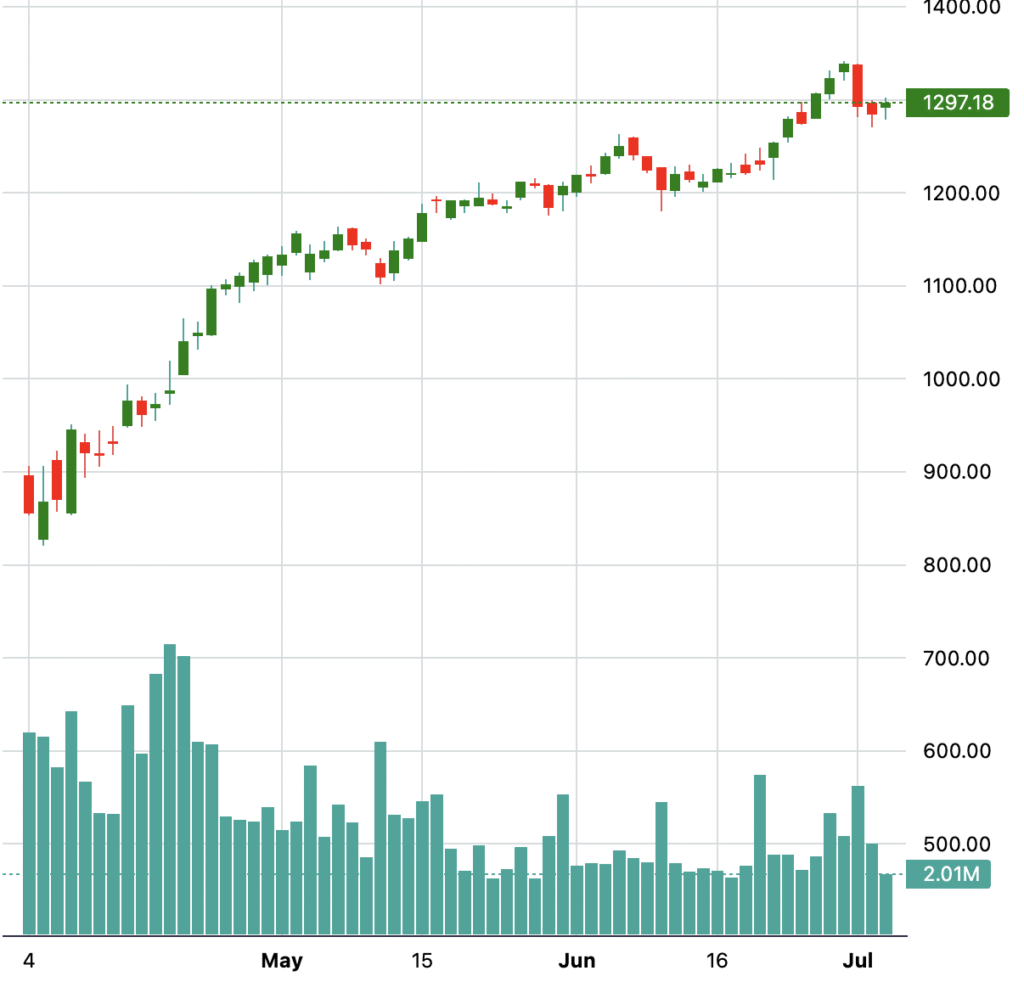
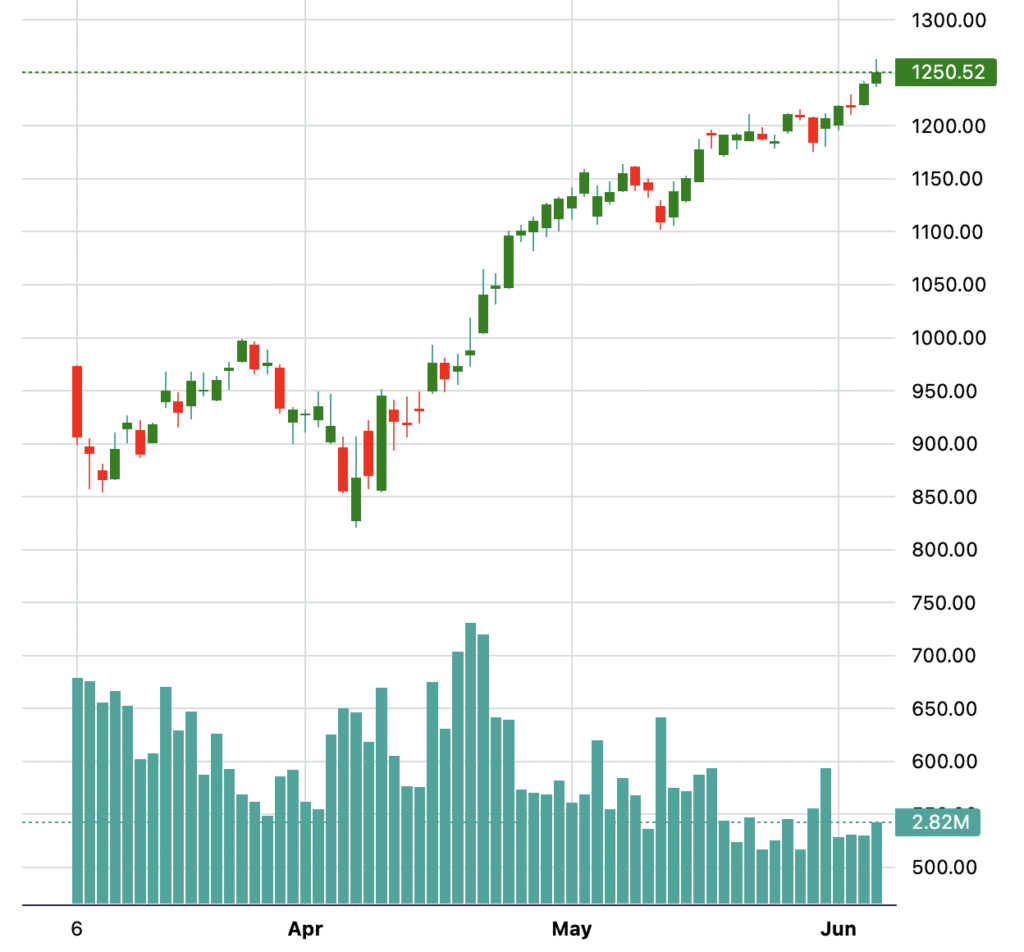
Mid-2025 Capitulation & Swift Rebound
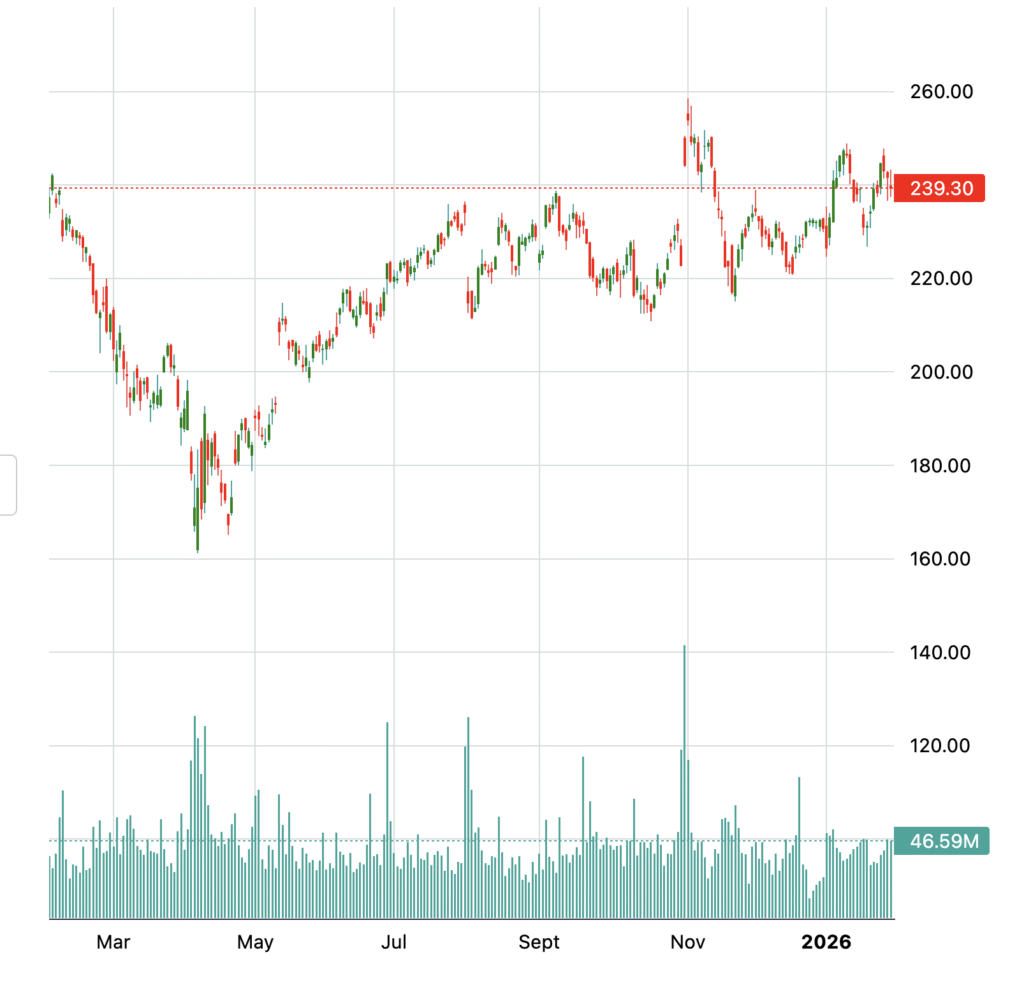
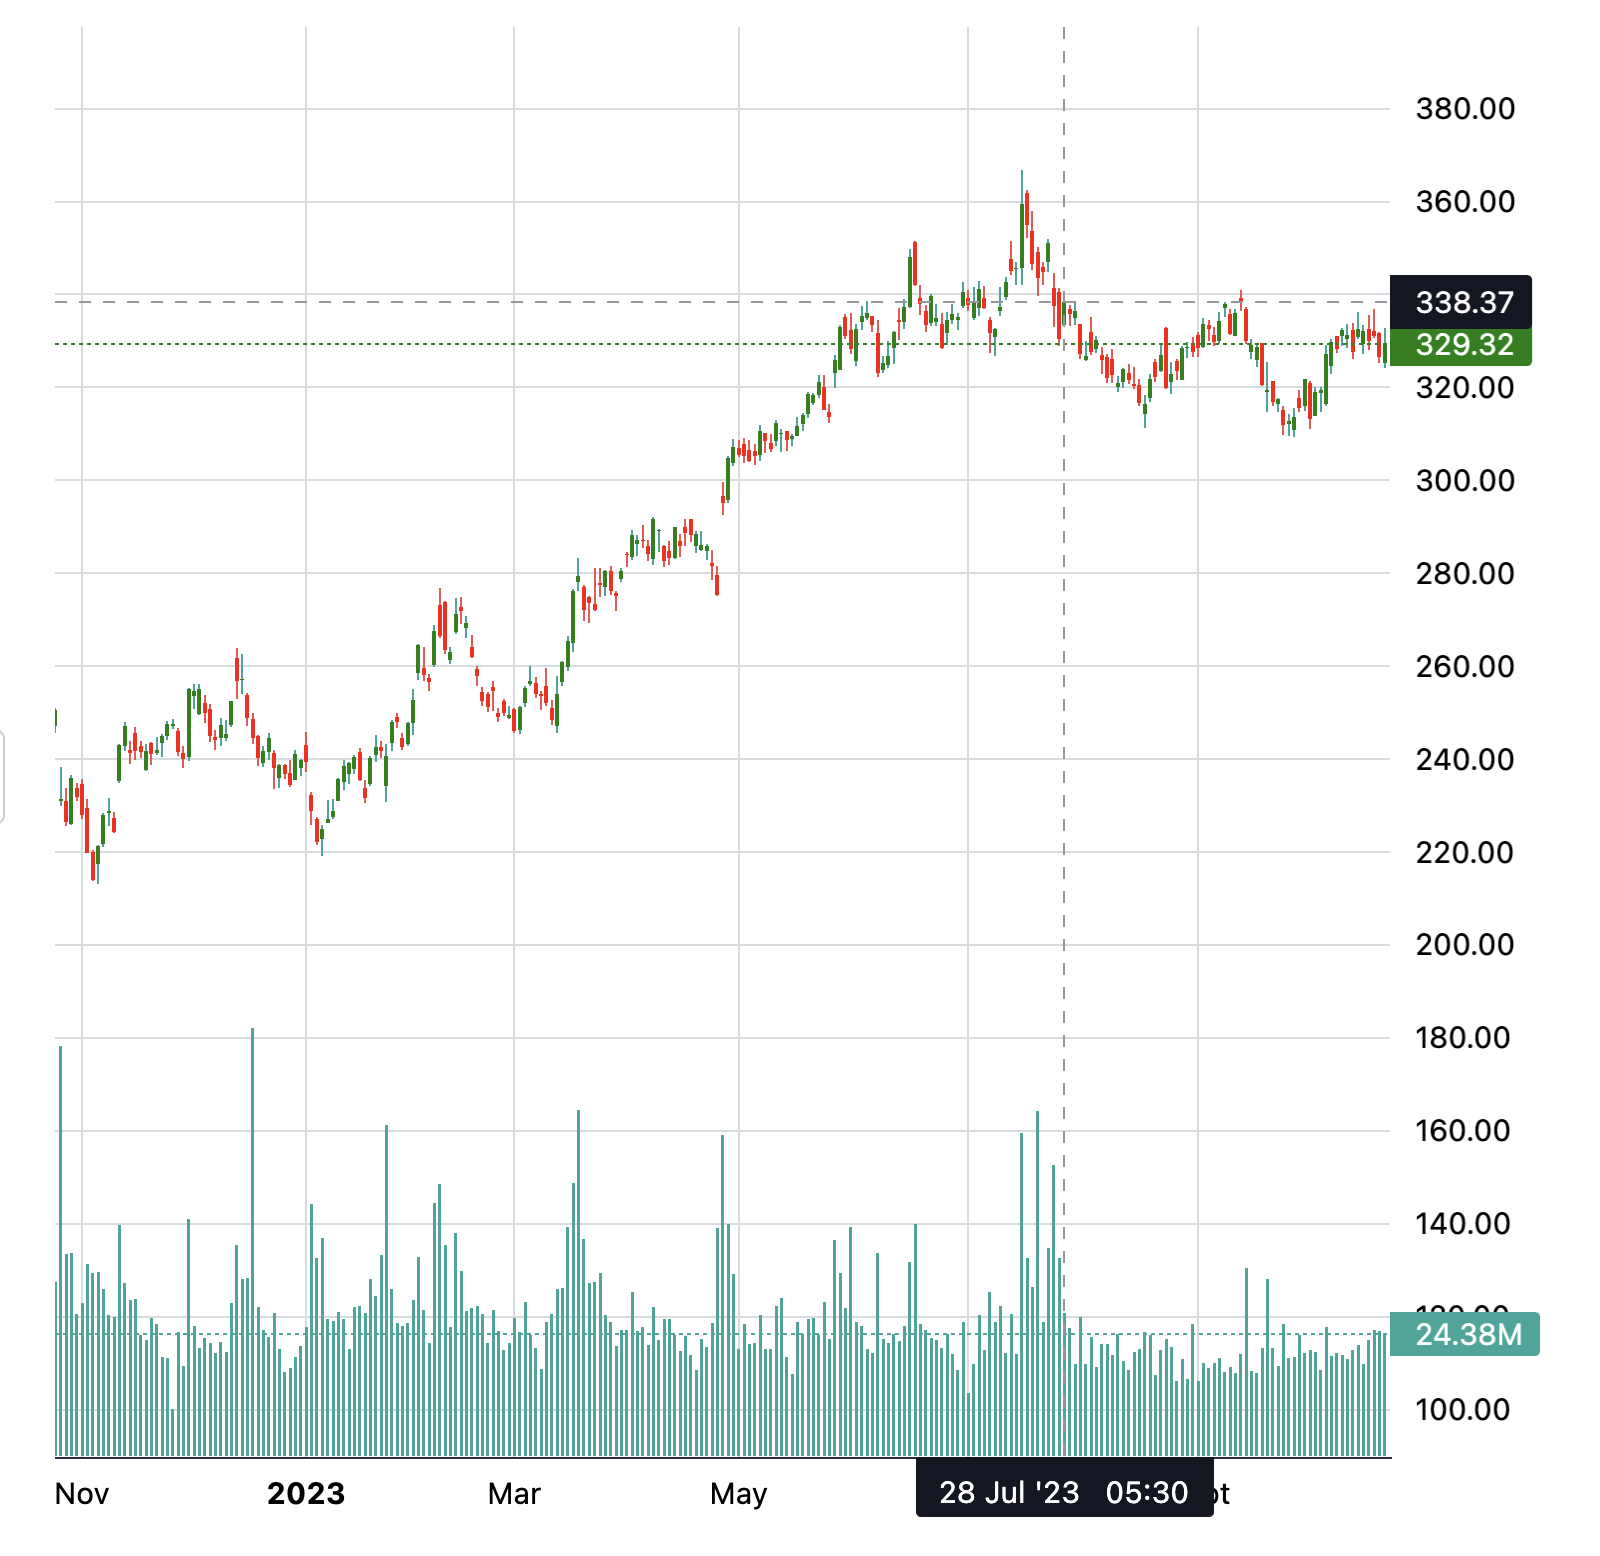
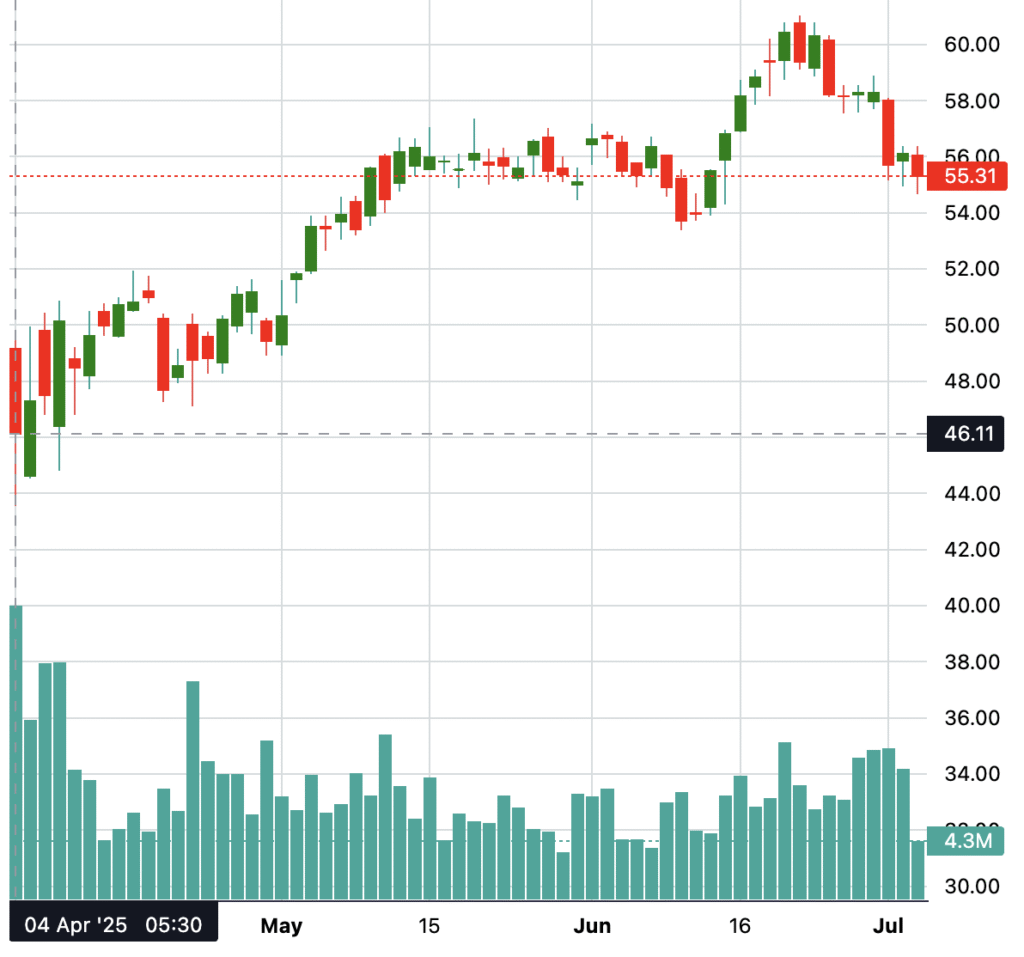
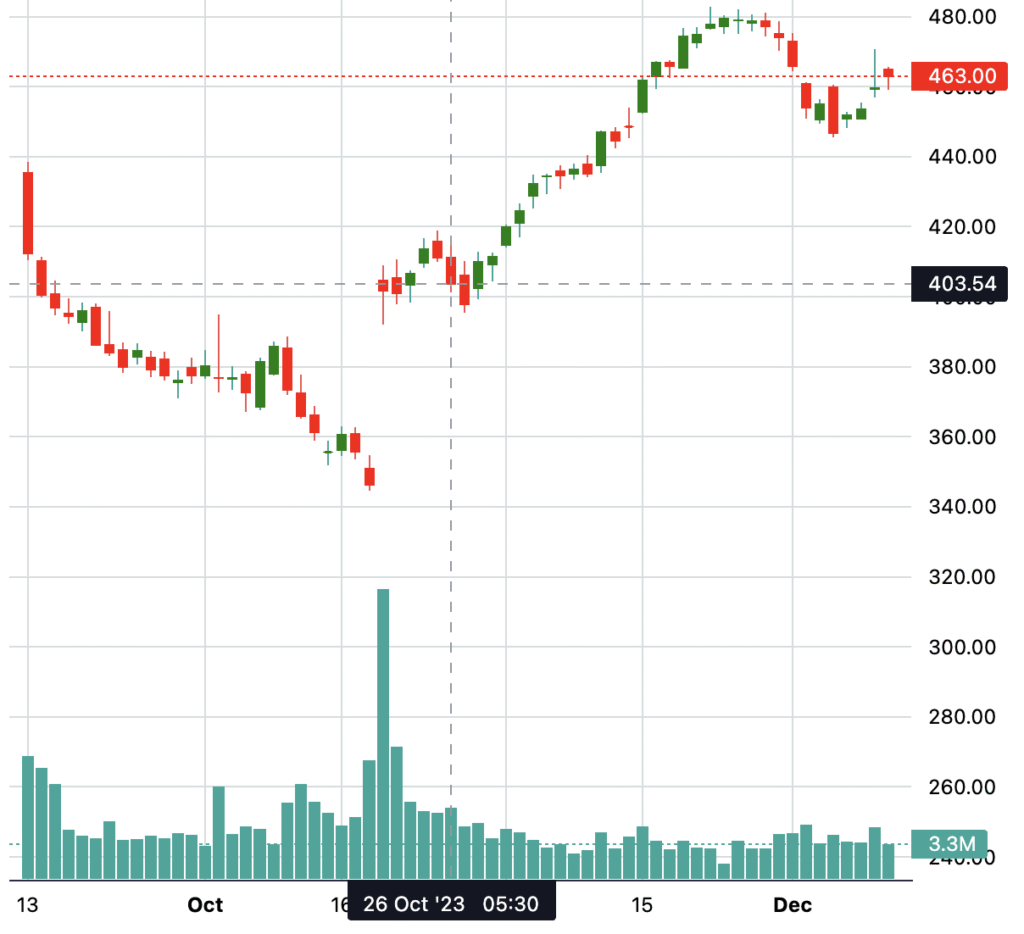
The chart shows AMZN peaking near $240 in early 2025 before a steep ~35% correction to $160 lows around late summer (Apr/May), driven by profit-taking after the rally, potential earnings weakness, or macro headwinds. Recovery was strong from the $160 bottom: AMZN staged a steady recovery over the next ~6 months through late 2025. This ~50% rebound was driven by stabilizing support, holiday sales momentum, AWS growth re-acceleration, and cost efficiencies.
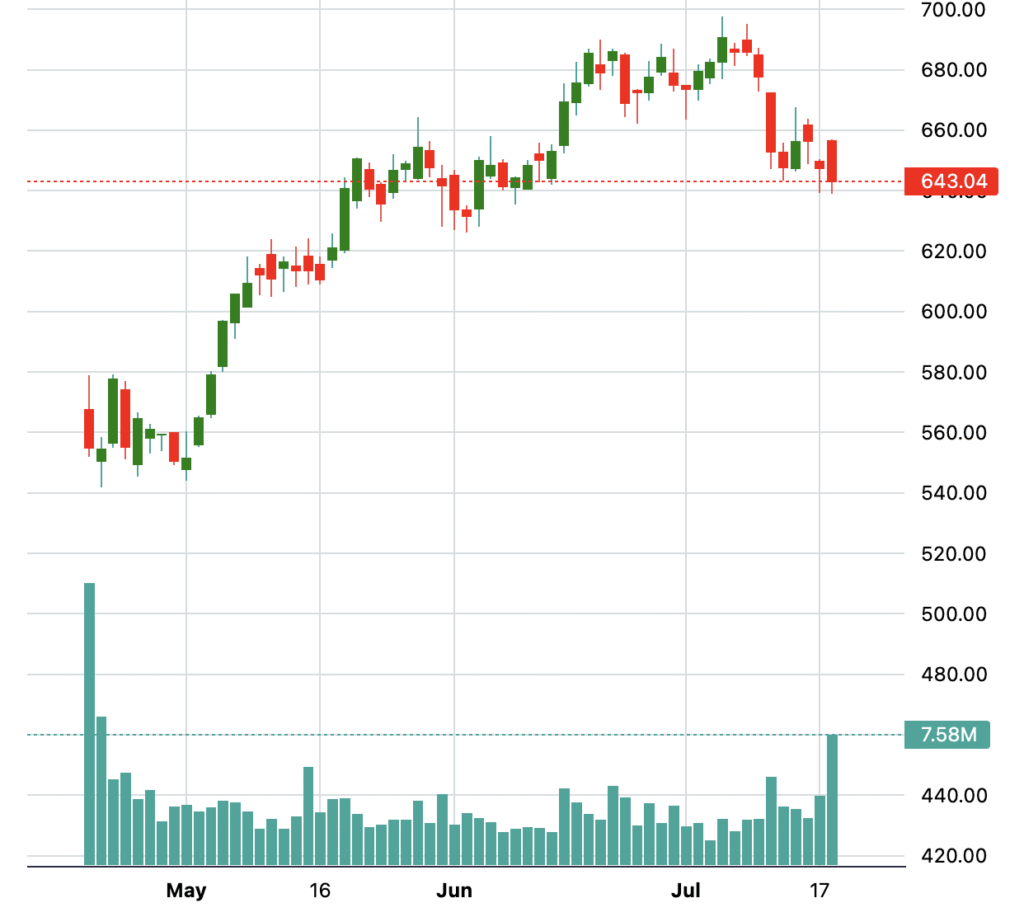
2022 Bear Lows to Bull Revival
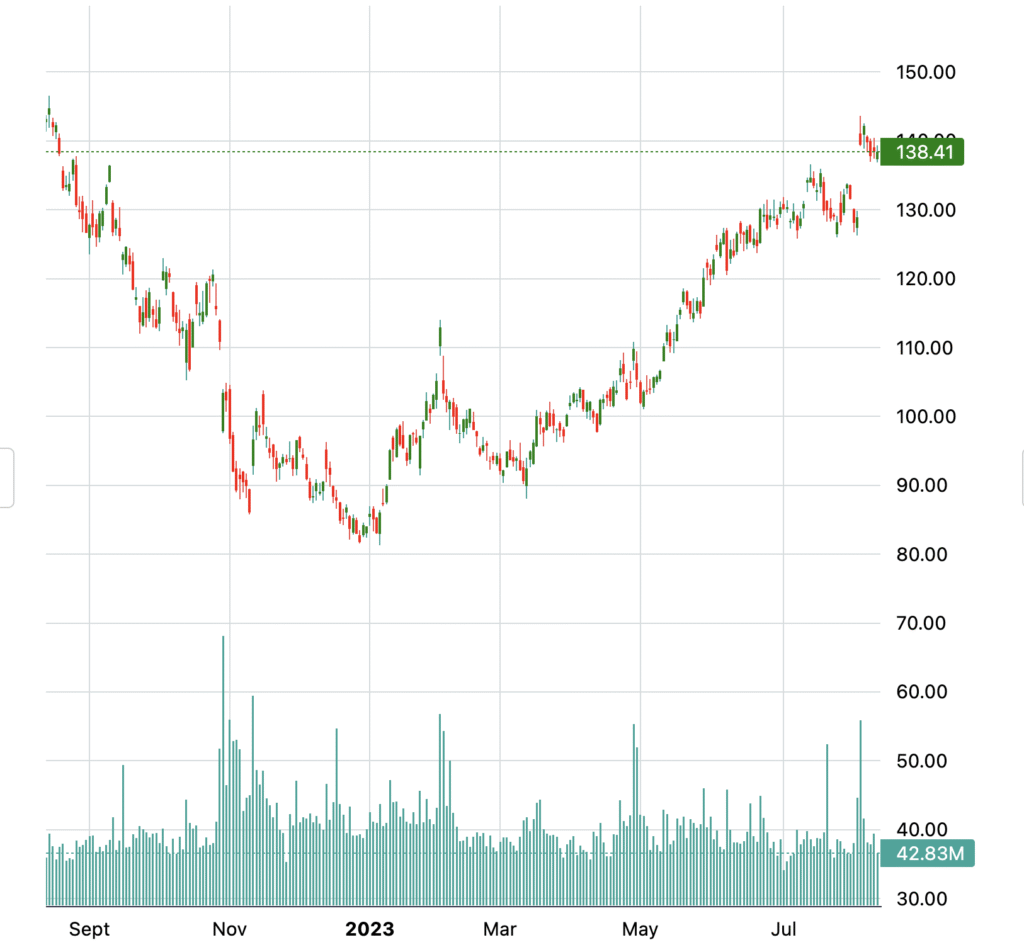
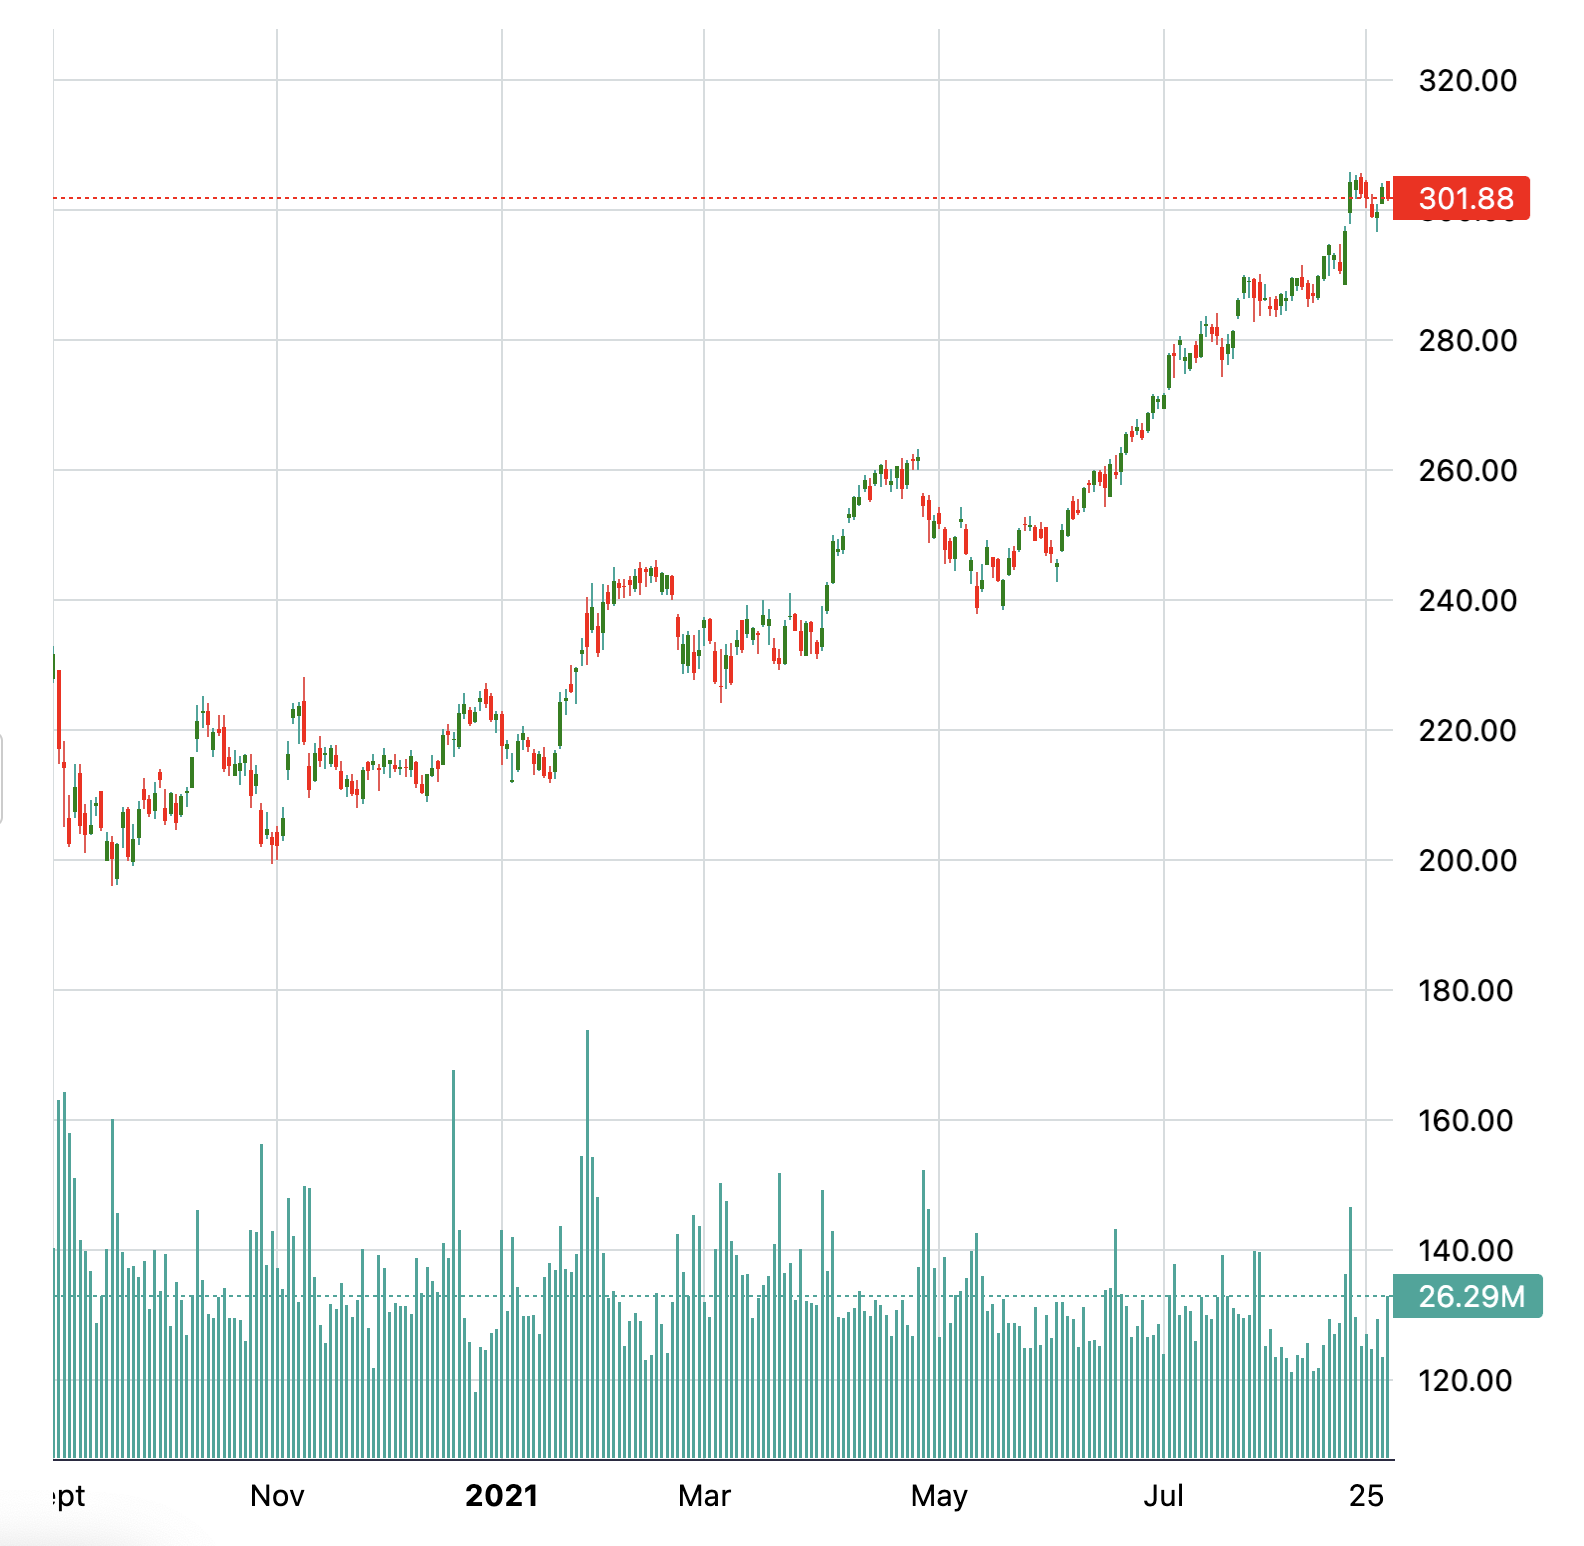
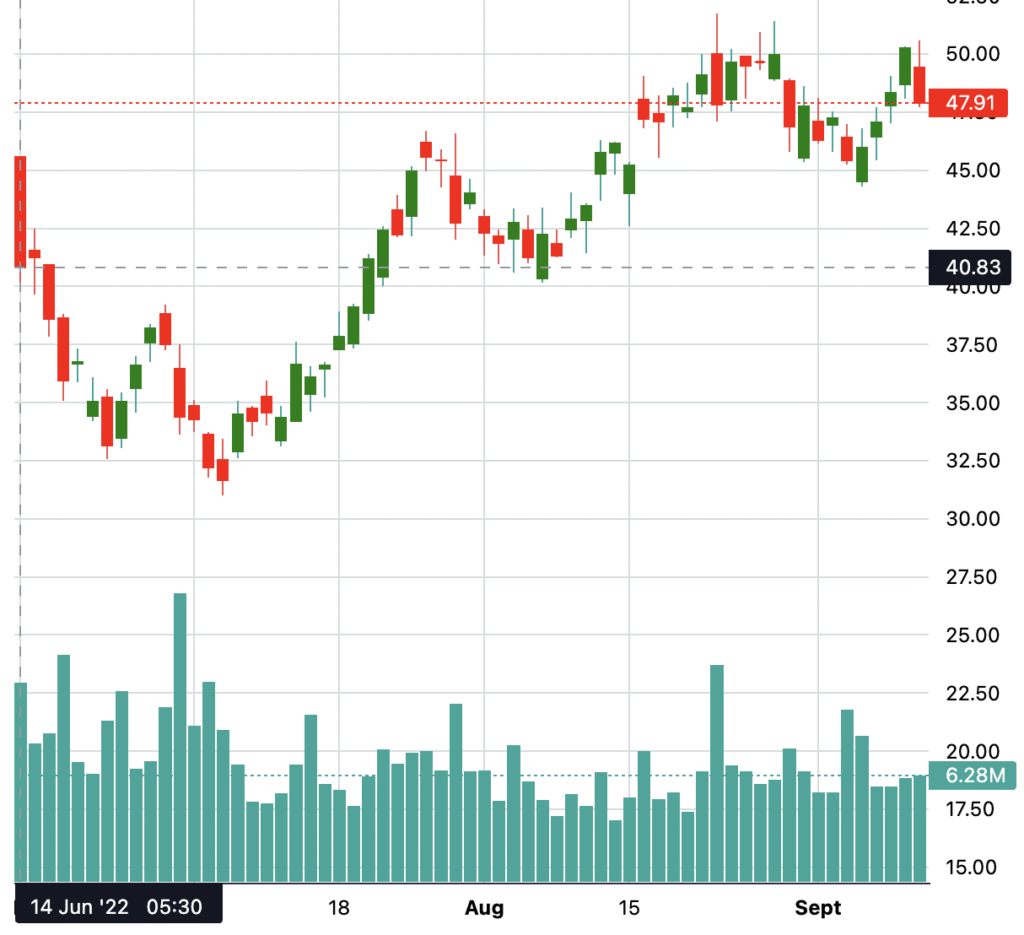
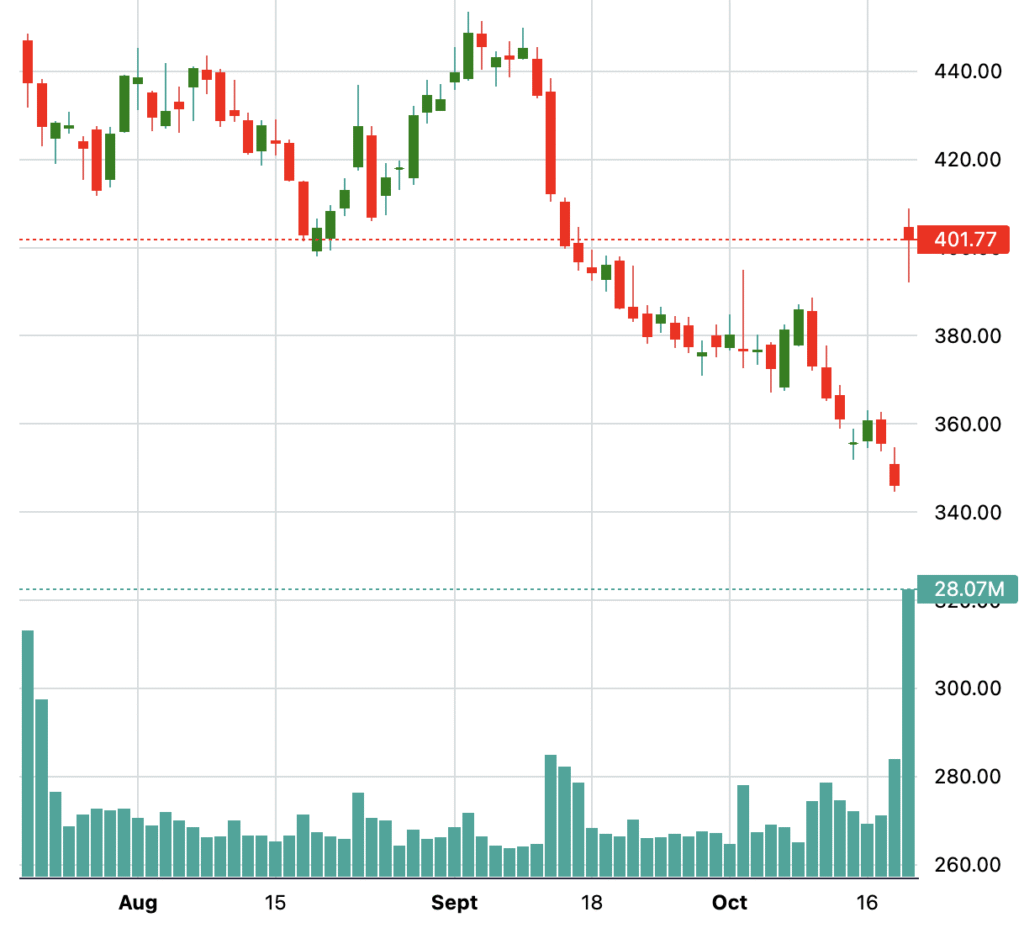
The chart shows AMZN plunging from ~$140 highs (September 2022) to ~$80 lows around December 2022 amid bear market pressures, post-COVID e-commerce slowdown, and high volume (38M shares) capitulation, before launching a powerful recovery to $150+ by Sep 2023. From its $80 lows in December 2022, AMZN executed a robust ~75% recovery to $140 by August 2023, fueled by AWS revenue acceleration, aggressive cost reductions post-layoffs, and renewed Prime subscription growth as post-COVID e-commerce stabilized—transforming bear market capitulation into a classic V-shaped revival over eight months.
Lessons from AMZN Historic Recoveries
Amazon’s two past corrections reveal key patterns: deep dips (~40-50% from peaks) like 2022-23 and mid-2025 trigger capitulation selling on volume spikes, but strong fundamentals drive V-shaped rebounds within 8-12 months via AWS growth, cost efficiencies, and seasonal tailwinds. Short-term panic creates entry points for patient investors, as shares consistently test prior highs post-recovery despite macro noise.
Disclaimer
This analysis is for educational/study purposes only—not financial advice. Past performance doesn’t guarantee future results. Data from public sources like Yahoo Finance. Consult advisors; author disclaims liability.