Yesterday, Oracle stock surged an extraordinary 36% in a single day—a historic move for a company of its size—after the company released an impressive earnings report and future forecast that stunned Wall Street. The rally was driven by astonishing growth in Oracle’s cloud backlog and a bullish outlook for its AI-powered infrastructure business, pushing the company toward the $1 trillion market cap club and marking Oracle’s biggest one-day gain since 1992. To understand how Oracle (ORCL) fares in the months that follow these exceptional days, let’s dive into two separate years when the stock posted a standout single-day gain, examining the subsequent one-year price action as shown in the chart images provided.
Oracle’s Big Move and the Year that Followed (13th March 2020) – 20.43% single-day gain
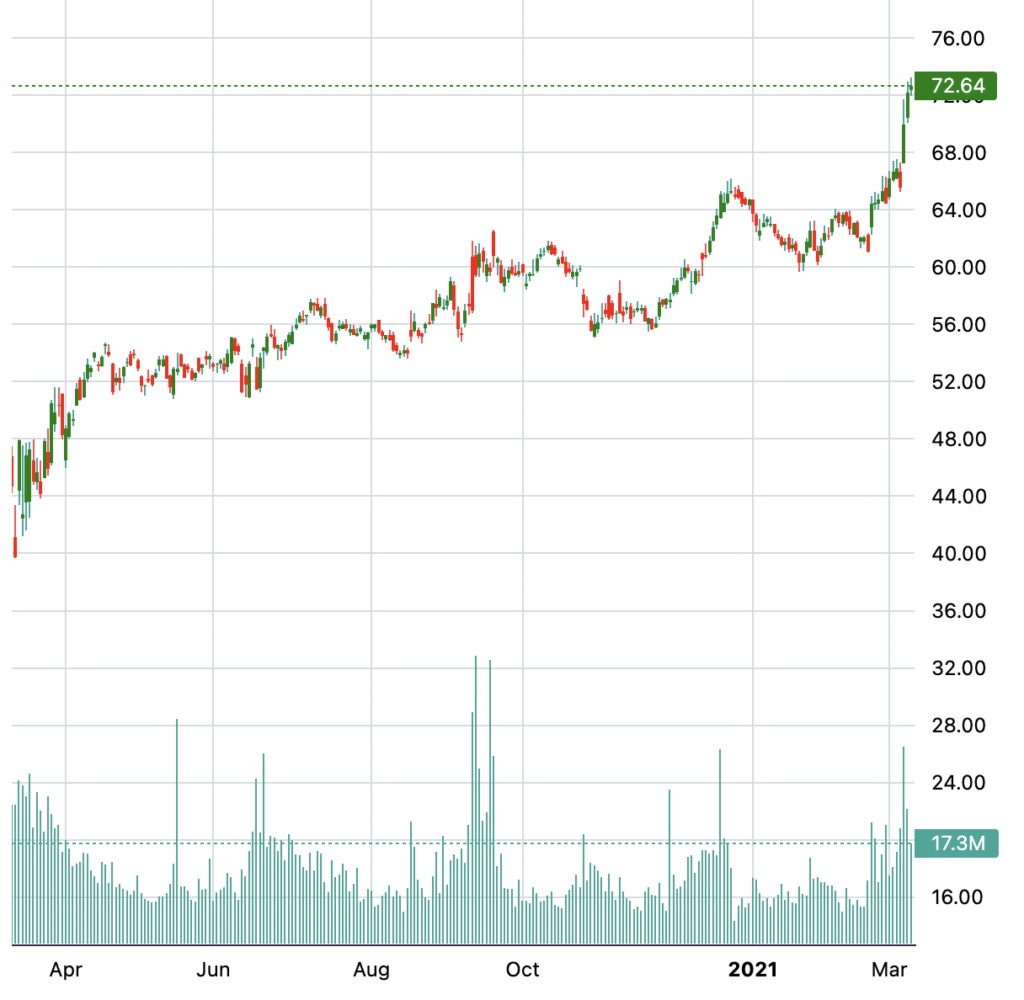
In the first instance, captured in the initial chart, Oracle’s share price broke out with a sharp rally, pushing up to the $70s—closing at around $72.64 on a surge of high trading volume. This breakout, occurring around the spring of 2020, typically signals renewed investor confidence, often tied to blowout earnings, product launches, or optimistic forward guidance.
Instead of a one-day wonder, this move sparked a sustained bullish trend over the next year. The price action following the large green candlestick reveals:
- Steady Uptrend: After the initial spike, Oracle’s stock continued to grind higher, respecting short-term pullbacks but ultimately holding above key support zones.
- Healthy Consolidation: Throughout the summer and into early fall, the price consolidated, forming a series of higher lows. This behavior is typical of strong bull runs, where periods of sideways movement help reset the technical setup before the next leg higher.
- Second Wind: As the year progressed, buying activity accelerated, with the stock not only maintaining its gains but also surging to new highs, supported by consistently elevated volume throughout pivotal sessions. By the end of the chart’s timeframe, Oracle’s price eclipsed $70, closing near session highs—a clear indicator that investors who bought during the breakout would have seen substantial appreciation had they held their positions.
Oracle’s Post-Surge Behavior (10th December 2021) – 15.61% single-day gain
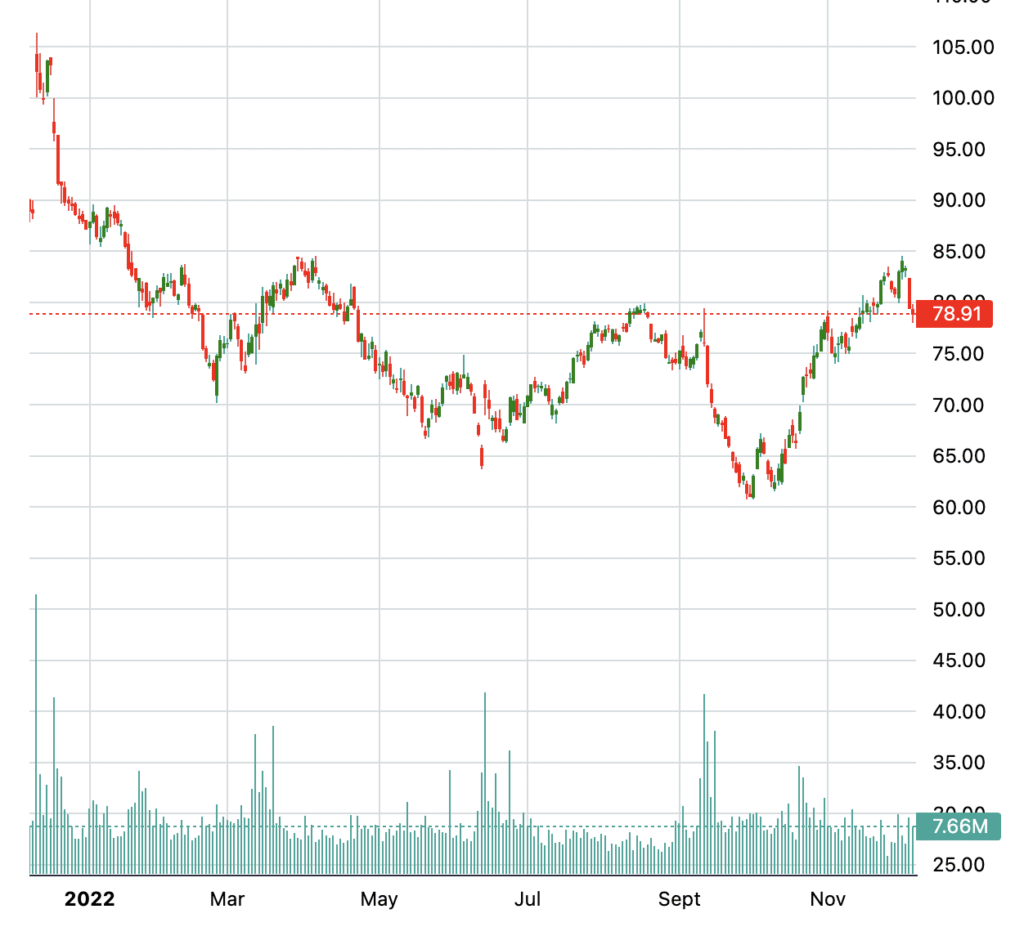
The second chart offers a contrasting, equally insightful example. In this case, Oracle saw a remarkable one-day jump at the onset of 2022, breaking above $90 but, as the year played out, the mood shifted. Key observations from the second one-year period after the high single-day gain include:
- Downtrend Pressure: Shortly after the big move, Oracle’s momentum faded. The stock rapidly lost altitude, sliding below $80 within the first several months. Persistent downtrends like this can result from a challenging macro environment, valuation concerns, or shifts in growth expectations.
- Volatility and Recovery Attempts: The year was riddled with failed rallies and volatile swings. While ORCL made several attempts to rally back toward its previous highs, each bounce met resistance, resulting in more complex price patterns. A significant dip tested investor resolve in the summer months, with shares dropping toward the $65 area.
- Late-Year Bounce: Despite a tough start, Oracle shares showed resilience later in the year. A determined rally pushed the stock back to the high $70s and low $80s by November—demonstrating the company’s underlying strength and the willingness of long-term investors to step in at perceived value levels.
Key Takeaways for Investors
Analyzing both periods reveals several important insights for Oracle shareholders and market watchers:
- Sustained Momentum Can Vary: A major single-day gain doesn’t uniformly guarantee a smooth uptrend. In some years, like the first charted period, momentum builds and pushes prices to new highs. In others, like 2022, profit-taking and broader market factors can erase the initial excitement.
- Volume Confirmation Is Critical: Both charts show spikes in trading activity on breakout days, affirming institutional interest. Sustained volume on up days often predicts better follow-through.
- Volatility Is the Norm: Post-breakout periods are marked by volatility. Even when the broader trend is positive, there can be multi-month stretches of choppy or declining action. Patience is vital.
- Buying on Strength vs. Waiting: Investors must decide whether to chase a strong breakout or wait for follow-through and consolidation. Both approaches had periods of success but required discipline and clear exit strategies.
Conclusion
Oracle’s action in the year after a major single-day gain highlights the complexities and opportunities in momentum investing. While some years rewarded quick and patient holders alike, others demanded adaptability and a long-term perspective amid bumps, corrections, and eventual rebounds. For those tracking Oracle, these historical patterns suggest that understanding the context behind big moves—and being prepared for both sustained gains and volatility—remains crucial when navigating this blue-chip tech stock.
Disclaimer:
The information, analysis, and images presented in this article are intended solely for educational and study purposes. While every effort has been made to ensure the validity and accuracy of the data, the author does not guarantee the completeness or correctness of any information, and charts should be interpreted as illustrative examples only. Stock price movements are subject to numerous unpredictable factors, and past performance does not ensure future results.
Readers are strongly encouraged to conduct their own due diligence and consult with a qualified financial advisor before making any investment decisions. The content herein does not constitute investment advice or a recommendation to buy or sell any securities. Always use independent judgment and consider your individual financial goals and risk tolerance when analyzing stock trends and opportunities.