
Sharp corrections in Microsoft (MSFT) stock, like the recent ~10-12% intraday plunge on January 29, 2026, amid AI capex concerns and softer Azure growth guidance, often precede strong rebounds. Historical charts reveal consistent patterns of recovery over quarters and a year post-drop, offering optimism for investors. This analysis uses attached 1-year charts from two key past events to illustrate resilience.
September 3, 2020: Sell-off triggered by CEO Satya Nadella’s $75M share sale
MSFT stock dropped ~6% on September 3, 2020—followed by another 5% decline on September 8—amid a broader tech sell-off sparked by CEO Satya Nadella’s $75M share sale (a pre-planned 10b5-1 trade). High volume (58M shares) intensified the pullback from recent highs.
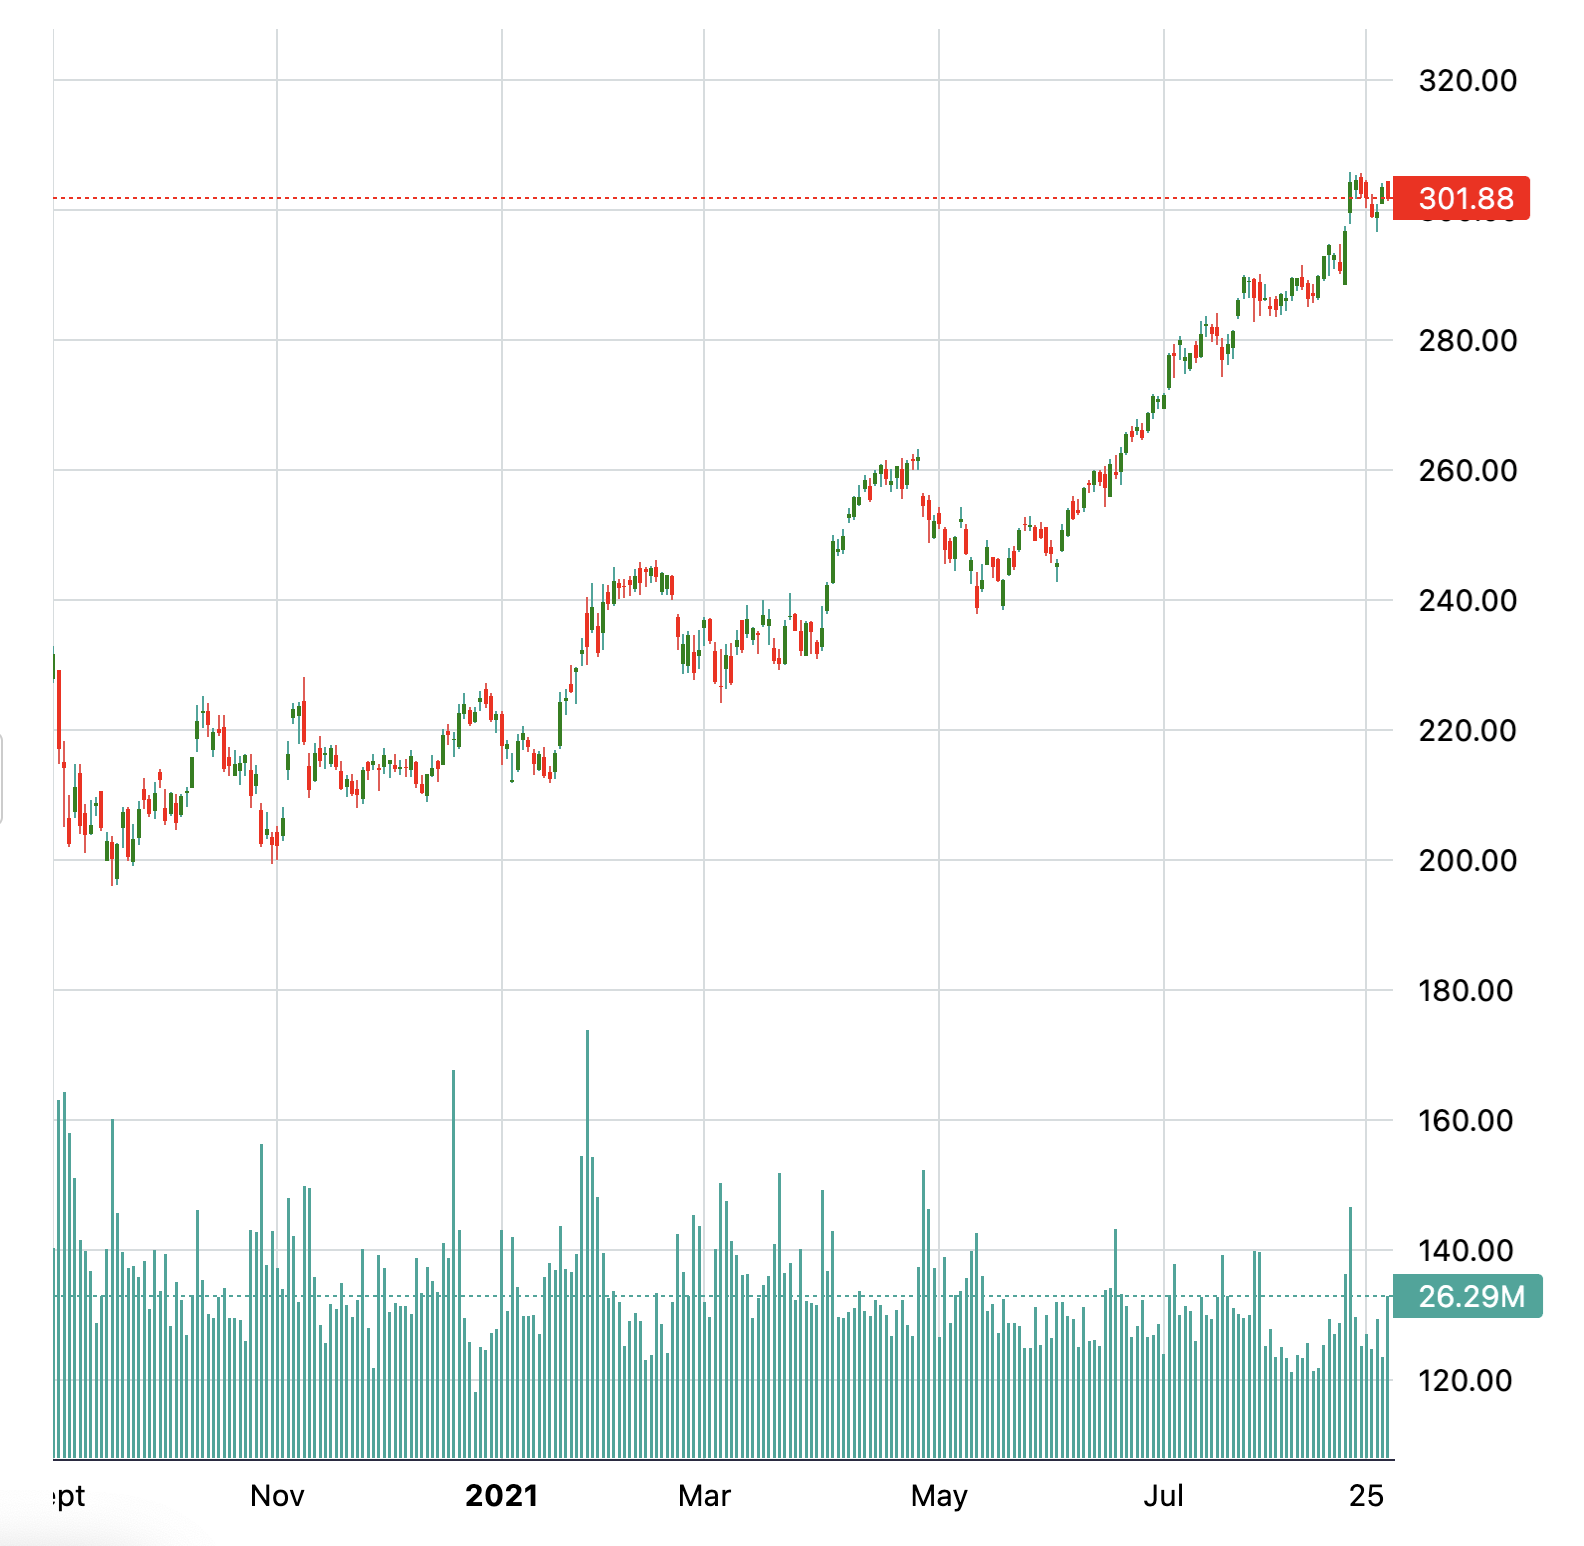
From the drop close, MSFT gained ~25% in one quarter, ~40% in two quarters, and ~55%+ after one year, outperforming broader indices amid remote work tailwinds.
October 26, 2022: Post-Earnings Pullback
Around October 26, 2022, MSFT corrected ~8% from recent highs, tied to broader market weakness and earnings digestion after a strong 2022 run. The 1-year chart captures a V-shaped recovery, climbing ~40% by late 2023 as AI hype built around Copilot and Azure.
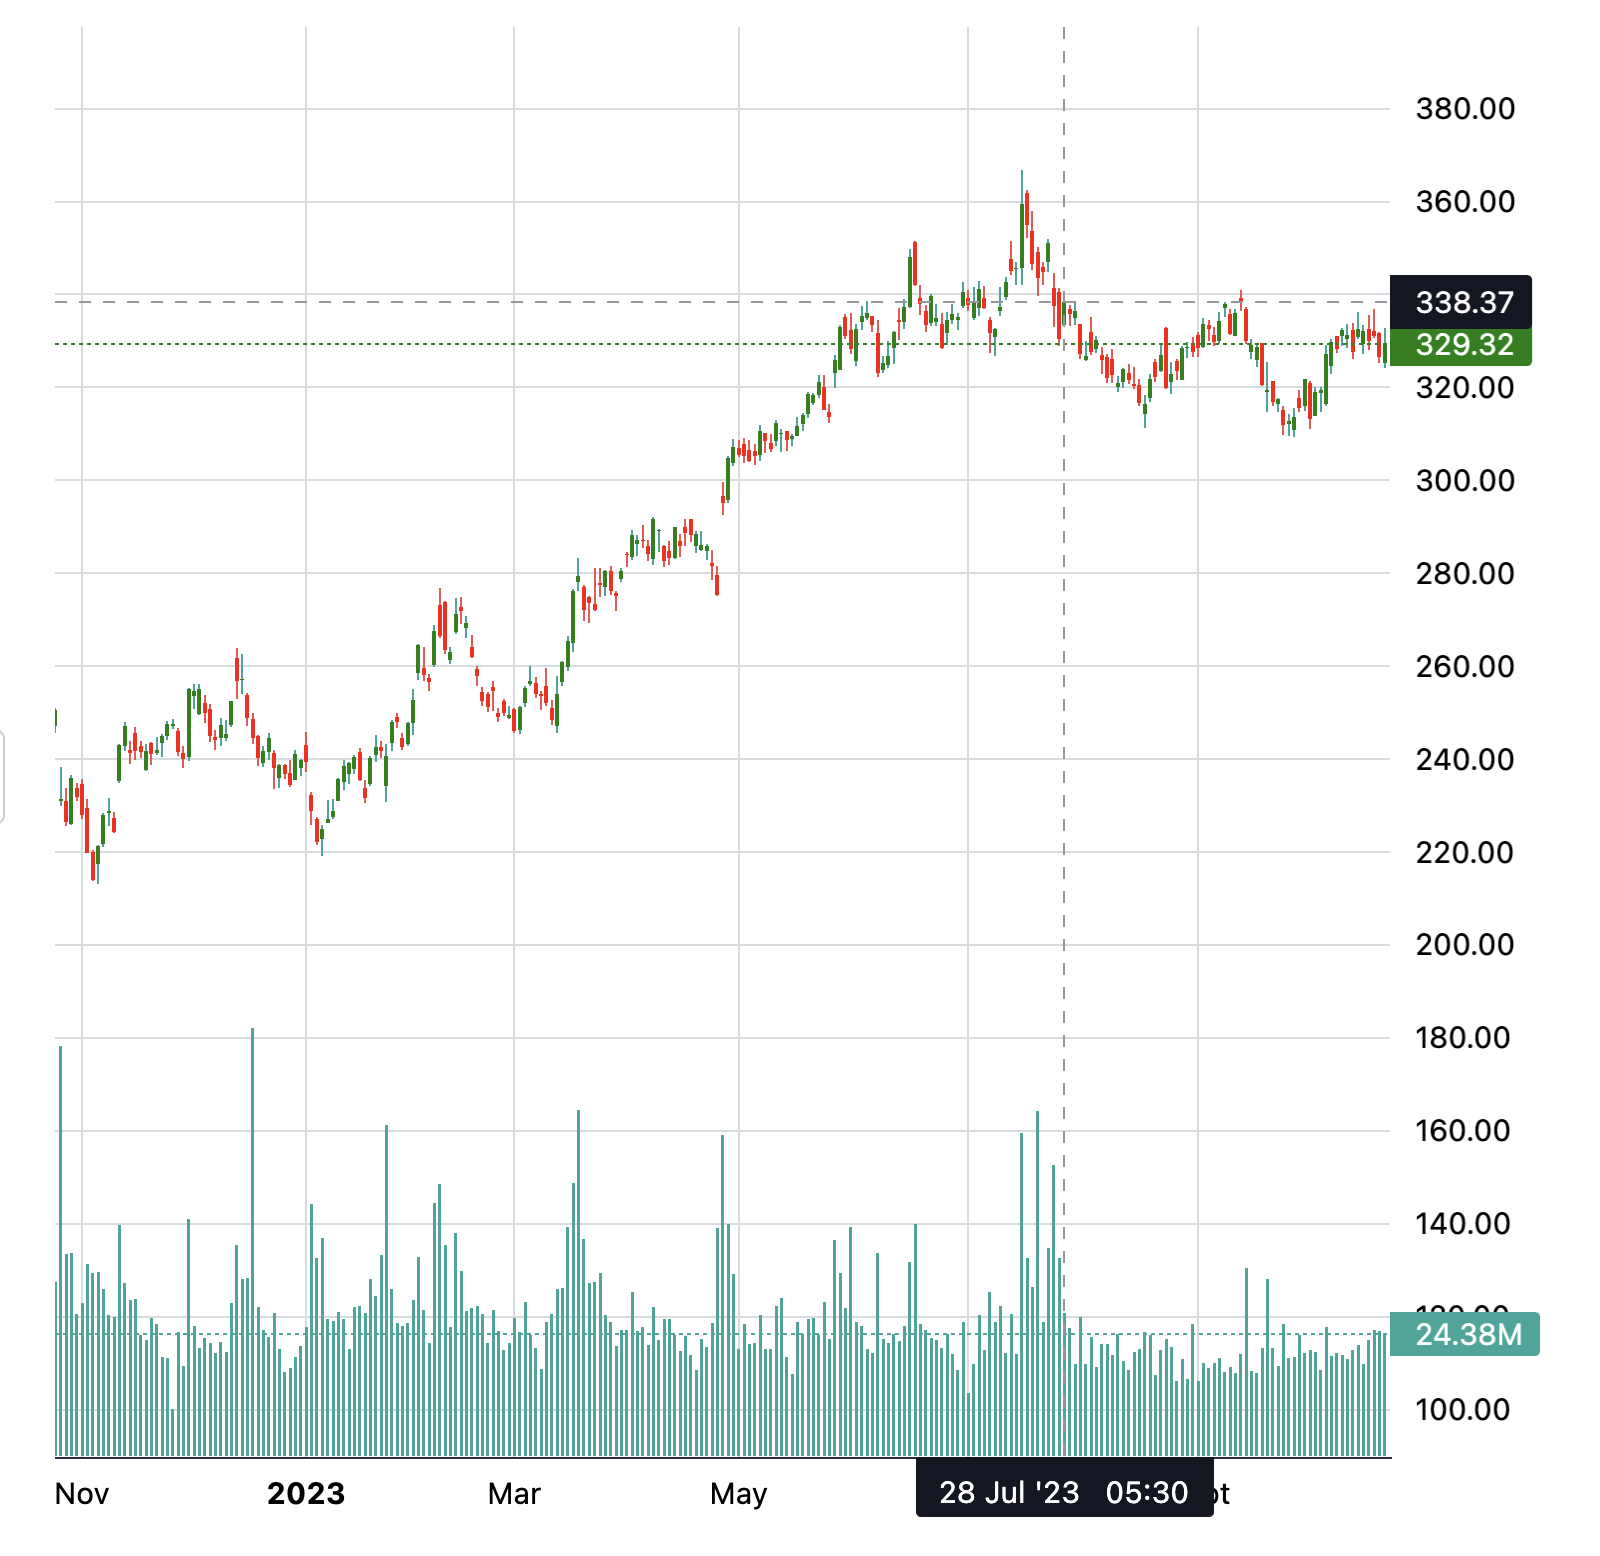
Key metrics: ~20% rebound in one quarter, ~30% in two, and ~40% at the one-year mark, fueled by enterprise AI adoption.
Performance Comparison Table
| Event Date | Drop % | 1Q Later | 2Q Later | 1Y Later |
|---|---|---|---|---|
| Sep 3, 2020 | -6% | +20% | +40% | +55%+ |
| Oct 26, 2022 | -10%+ | +20% | +30% | +40% |
| Jan 29, 2026 | -10% | TBD | TBD | TBD |
Outlook for 2026 Correction
These precedents suggest MSFT’s quality business—bolstered by Azure, Office, and AI leadership—drives post-correction upside, often 20-60% over a year despite short-term volatility. The recent drop, erasing $350B+ in market cap, mirrors 2020’s scale but occurred from all-time highs, positioning for similar gains if AI investments pay off. Investors may view this as a buying opportunity, per analysts maintaining overweight ratings. Track upcoming quarters for Azure acceleration.
Disclaimer
investment recommendations, or an endorsement of any trading strategy. Past stock performance does not guarantee future results. Stock price data is sourced from public financial databases. Always conduct your own research and consult a qualified financial advisor before making investment decisions. The author assumes no liability for any actions taken based on this content
Leave a Reply